

[Bitcoin Decline] Return-sell signal using the recent low, moving average, and mBDSR (RCI two-filter)
0
【Mastering RCI!! Trend Reversal, Buy on Dips, Sell on Rallies】
Indicator that shines when combined with RCI【BODSOR・mBDSR】
and methodology・case studies (PDF) ★GogoJungle AWARD2020 winner★
https://www.gogojungle.co.jp/tools/indicators/11836
Bitcoin / USD BTCUSD 1-hour chart
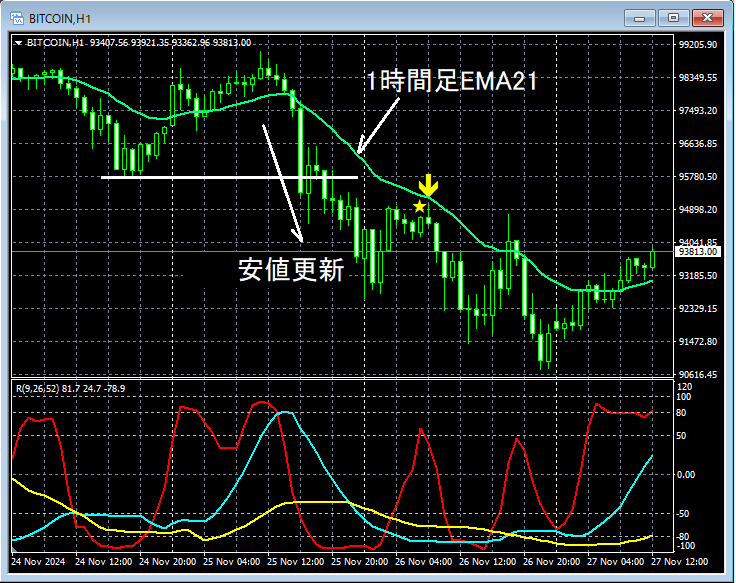
On the 1-hour chart above,it has fallen by breaking below the recent lowand then, in this case, around the area important tothe 1-hour EMA21rises tomBDSR (two RCI lines filter)sell signal lights up, and price subsequently declines further.
From this example,it becomes clear that a trading approach focusing on Dow Theory and moving averagesandthe signals from mBDSRhave a high degree of compatibility.
*Please note that in the charts shown in this article, for convenience of explanation, circles, lines, and rectangles may have been added.
Indicator that shines when combined with RCI【BODSOR・mBDSR】
and method・case studies (PDF) ★GogoJungle AWARD2020 winner★
https://www.gogojungle.co.jp/tools/indicators/11836
The PDF file comes with 358 items (over 1,400 pages, over 470,000 characters).
Many of them areexamples that logically link higher-timeframe and lower-timeframe by using three-line RCI to examine the situation of multiple lower timeframes sequentially, ultimately waiting for the dips to buy or rallies to sell on the lower timeframes (i.e., the signals of mBDSR)..
Also,many focus on pinpointing points where multiple entry reasons overlap..
Additionally,there are methods for exploring upside targets and downside targets using three-line RCI..
In the descriptions within the PDF file,over 1,350 chartsare used.

Indicator that shines when combined with RCI【BODSOR・mBDSR】
and methodology・case studies (PDF) ★GogoJungle AWARD2020 winner★
https://www.gogojungle.co.jp/tools/indicators/11836
Bitcoin / USD BTCUSD 1-hour chart
On the 1-hour chart above,it has fallen by breaking below the recent lowand then, in this case, around the area important tothe 1-hour EMA21rises tomBDSR (two RCI lines filter)sell signal lights up, and price subsequently declines further.
From this example,it becomes clear that a trading approach focusing on Dow Theory and moving averagesandthe signals from mBDSRhave a high degree of compatibility.
*Please note that in the charts shown in this article, for convenience of explanation, circles, lines, and rectangles may have been added.
Indicator that shines when combined with RCI【BODSOR・mBDSR】
and method・case studies (PDF) ★GogoJungle AWARD2020 winner★
https://www.gogojungle.co.jp/tools/indicators/11836
The PDF file comes with 358 items (over 1,400 pages, over 470,000 characters).
Many of them areexamples that logically link higher-timeframe and lower-timeframe by using three-line RCI to examine the situation of multiple lower timeframes sequentially, ultimately waiting for the dips to buy or rallies to sell on the lower timeframes (i.e., the signals of mBDSR)..
Also,many focus on pinpointing points where multiple entry reasons overlap..
Additionally,there are methods for exploring upside targets and downside targets using three-line RCI..
In the descriptions within the PDF file,over 1,350 chartsare used.
× ![]()


