

From today's chart: a short signal to sell on pullback using moving averages, a counter-trend line, and mBDSR (RCI two-filter).
0
【Mastering RCI!! Trend Reversal, Buy on Dips, Sell on Rallies】
Indicator that shines in combination with RCI: 【BODSOR・mBDSR】
Methods・Case Studies (PDF) ★GogoJungle AWARD2020 Winner★
https://www.gogojungle.co.jp/tools/indicators/11836
Canadian Dollar / Japanese Yen CADJPY 5-minute chart
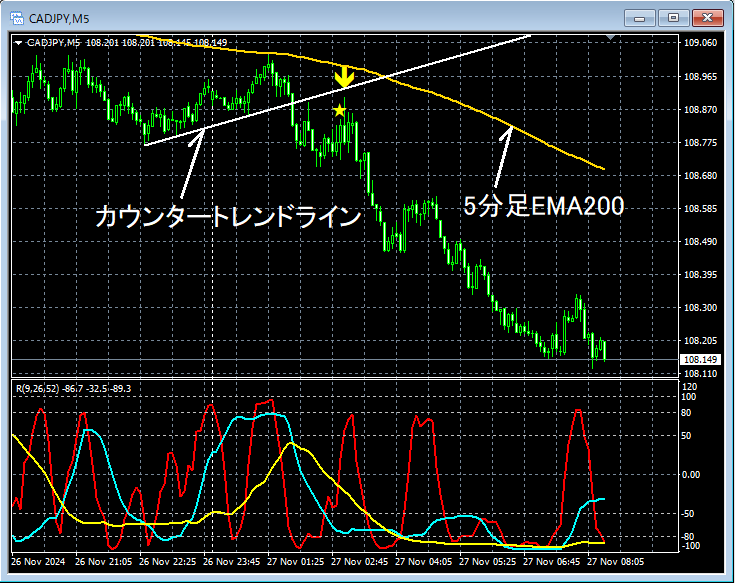
The status of the higher timeframe is omitted. In the upper 5-minute chart,5-minute EMA200recoiled nearCounter-trend lineand rose after breaking below itmBDSR (two RCI filters) Sell on Rallies signallights up, followed by a substantial drop.
Moveaways from the key moving averages being respectedandBreak below the counter-trend lineandmBDSR (two RCI filters) Sell on Rallies signal activationare multiple entry justification overlapping.
From this example,trading method focusing on moving averages and counter-trend linesandthe harmony with mBDSR signalsare evident.
※Please note that the charts introduced in this article may have added circles, lines, or rectangles for explanatory convenience.
Indicator that shines in combination with RCI: 【BODSOR・mBDSR】
Methods・Case Studies (PDF) ★GogoJungle AWARD2020 Winner★
https://www.gogojungle.co.jp/tools/indicators/11836
The PDF file includes 358 files (over 1,400 pages, over 470,000 characters total).
Many of them are summaries of cases where multiple lower-timeframe situations are logically linked to higher-timeframe using three RCI lines, and ultimately wait for a dip-buying or rally-selling timing (i.e., mBDSR signal) on the lower timeframes.
Also,there are many that emphasize capturing points where multiple entry justifications overlap..
Additionally,there are methods that explore upside/downside targets using three RCI lines..
In the PDF explanations,more than 1,350 chartsare used.

Indicator that shines in combination with RCI: 【BODSOR・mBDSR】
Methods・Case Studies (PDF) ★GogoJungle AWARD2020 Winner★
https://www.gogojungle.co.jp/tools/indicators/11836
Canadian Dollar / Japanese Yen CADJPY 5-minute chart
The status of the higher timeframe is omitted. In the upper 5-minute chart,5-minute EMA200recoiled nearCounter-trend lineand rose after breaking below itmBDSR (two RCI filters) Sell on Rallies signallights up, followed by a substantial drop.
Moveaways from the key moving averages being respectedandBreak below the counter-trend lineandmBDSR (two RCI filters) Sell on Rallies signal activationare multiple entry justification overlapping.
From this example,trading method focusing on moving averages and counter-trend linesandthe harmony with mBDSR signalsare evident.
※Please note that the charts introduced in this article may have added circles, lines, or rectangles for explanatory convenience.
Indicator that shines in combination with RCI: 【BODSOR・mBDSR】
Methods・Case Studies (PDF) ★GogoJungle AWARD2020 Winner★
https://www.gogojungle.co.jp/tools/indicators/11836
The PDF file includes 358 files (over 1,400 pages, over 470,000 characters total).
Many of them are summaries of cases where multiple lower-timeframe situations are logically linked to higher-timeframe using three RCI lines, and ultimately wait for a dip-buying or rally-selling timing (i.e., mBDSR signal) on the lower timeframes.
Also,there are many that emphasize capturing points where multiple entry justifications overlap..
Additionally,there are methods that explore upside/downside targets using three RCI lines..
In the PDF explanations,more than 1,350 chartsare used.
× ![]()


