

Today's USD/JPY (2024/11/25) mid-market rate trade mBDSR (RCI two-filter) short-selling signal
0
【Mastering RCI!! Trend Reversals, Buy on Dips, Sell on Rallies】
Indicator【BODSOR・mBDSR】that shines when used with RCI
Methods and Case Studies (PDF) ★GogoJungle AWARD2020 winner★
https://www.gogojungle.co.jp/tools/indicators/11836
USD/JPY 1-minute chart
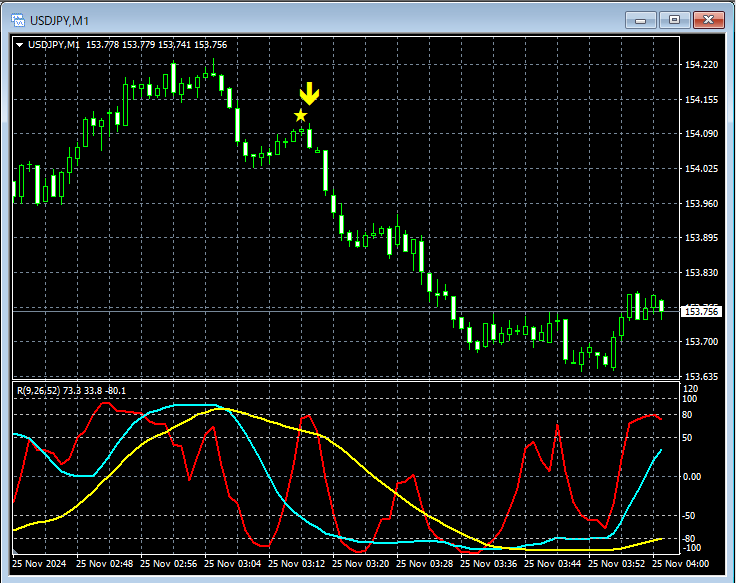
Looking at the top 1-minute chart,the call money rate passes, then it retracts. After that,the return-selling signal ofmBDSR (RCI two-filter) activatesand the price continues to fall.
From this example,a trading method focusing on the decline after the call money rate is passedandthe alignment with mBDSR signalsshows high compatibility.
※Please note that in the charts introduced in this article, for convenience, circles, straight lines, and squares may be added.
Indicator【BODSOR・mBDSR】that shines when used with RCI
Methods and Case Studies (PDF) ★GogoJungle AWARD2020 winner★
https://www.gogojungle.co.jp/tools/indicators/11836
The PDF file includes 358 files (over 1,400 pages, over 470,000 characters in total).
Many of these are aboutusing three-line RCI to logically link higher and lower timeframes, sequentially considering the conditions of multiple lower timeframes, and ultimately waiting for dip-buy signals or pullback-sell signals on the lower timeframe (i.e., mBDSR signals)..
Also,many emphasize identifying points where multiple entry reasons overlap..
Additionally,there are methods that explore upside and downside targets using the three-line RCI..
In the PDF explanations,more than 1,350 chartsare used.

Indicator【BODSOR・mBDSR】that shines when used with RCI
Methods and Case Studies (PDF) ★GogoJungle AWARD2020 winner★
https://www.gogojungle.co.jp/tools/indicators/11836
USD/JPY 1-minute chart
Looking at the top 1-minute chart,the call money rate passes, then it retracts. After that,the return-selling signal ofmBDSR (RCI two-filter) activatesand the price continues to fall.
From this example,a trading method focusing on the decline after the call money rate is passedandthe alignment with mBDSR signalsshows high compatibility.
※Please note that in the charts introduced in this article, for convenience, circles, straight lines, and squares may be added.
Indicator【BODSOR・mBDSR】that shines when used with RCI
Methods and Case Studies (PDF) ★GogoJungle AWARD2020 winner★
https://www.gogojungle.co.jp/tools/indicators/11836
The PDF file includes 358 files (over 1,400 pages, over 470,000 characters in total).
Many of these are aboutusing three-line RCI to logically link higher and lower timeframes, sequentially considering the conditions of multiple lower timeframes, and ultimately waiting for dip-buy signals or pullback-sell signals on the lower timeframe (i.e., mBDSR signals)..
Also,many emphasize identifying points where multiple entry reasons overlap..
Additionally,there are methods that explore upside and downside targets using the three-line RCI..
In the PDF explanations,more than 1,350 chartsare used.
× ![]()


