

[Yesterday 2024.11.23 USD/CHF] A 単: The moving averages we focus on, the recent high, and the mBDSR (RCI two-filters) pullback buying signal
【Mastering RCI!! Trend Reversal, Buy Dips, Sell Rallies】
Indicator that shines when combined with RCI: 【BODSOR・mBDSR】
Methods and Case Studies (PDF) ★GogoJungle AWARD2020 winner★
https://www.gogojungle.co.jp/tools/indicators/11836
Dollar-Swiss USDCHF 15-minute chart
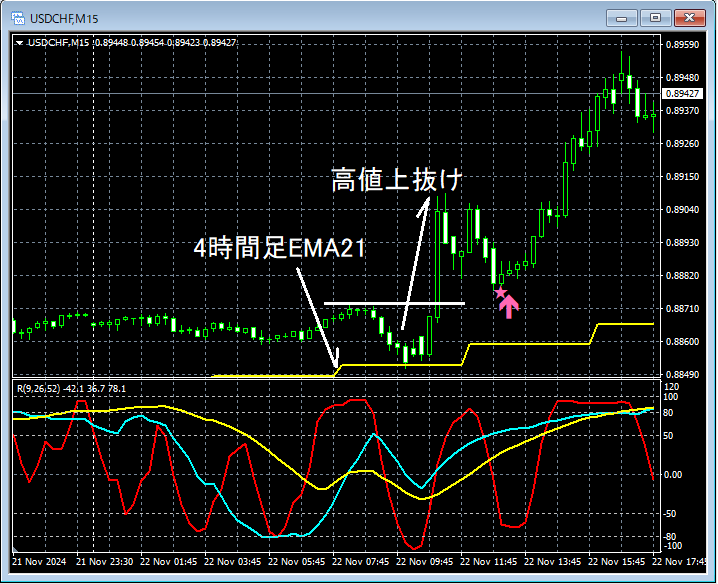
The situation on the higher time frame is omitted.
Looking at the upper 15-minute chart, it emphasizesthe 4-hour EMA21as a bounce level.After breaking above the recent highand then pulling back,the mBDSR (RCI two-line filter) dip-buy signallights up, and the price is clearly rising.
From this example,a trading method focusing on high highs and moving averagesandthe signal of mBDSRshow strong compatibility.
※Please note that in the charts referenced in this article, for the sake of explanation, circles, lines, rectangles, etc. may be drawn.
Indicator that shines when combined with RCI: 【BODSOR・mBDSR】
Methods and Case Studies (PDF) ★GogoJungle AWARD2020 winner★
https://www.gogojungle.co.jp/tools/indicators/11836
The PDF file includes 358 files (over 1,400 pages, over 470,000 characters).
Many of themare summaries showing how to logically link higher and lower timeframes using the RCI three-line, sequentially considering multiple lower timeframes, and ultimately waiting for dip buying or pullback selling timing (i.e., the mBDSR signal) on the lower timeframes..
Additionally,many focus on capturing points where multiple entry rationale coincide..
Also included is a method for exploring ascent and descent targets using the RCI three-line.
In the explanation within the PDF,more than 1,350 chartsare used.

Indicator that shines when combined with RCI: 【BODSOR・mBDSR】
Methods and Case Studies (PDF) ★GogoJungle AWARD2020 winner★
https://www.gogojungle.co.jp/tools/indicators/11836
Dollar-Swiss USDCHF 15-minute chart
The situation on the higher time frame is omitted.
Looking at the upper 15-minute chart, it emphasizesthe 4-hour EMA21as a bounce level.After breaking above the recent highand then pulling back,the mBDSR (RCI two-line filter) dip-buy signallights up, and the price is clearly rising.
From this example,a trading method focusing on high highs and moving averagesandthe signal of mBDSRshow strong compatibility.
※Please note that in the charts referenced in this article, for the sake of explanation, circles, lines, rectangles, etc. may be drawn.
Indicator that shines when combined with RCI: 【BODSOR・mBDSR】
Methods and Case Studies (PDF) ★GogoJungle AWARD2020 winner★
https://www.gogojungle.co.jp/tools/indicators/11836
The PDF file includes 358 files (over 1,400 pages, over 470,000 characters).
Many of themare summaries showing how to logically link higher and lower timeframes using the RCI three-line, sequentially considering multiple lower timeframes, and ultimately waiting for dip buying or pullback selling timing (i.e., the mBDSR signal) on the lower timeframes..
Additionally,many focus on capturing points where multiple entry rationale coincide..
Also included is a method for exploring ascent and descent targets using the RCI three-line.
In the explanation within the PDF,more than 1,350 chartsare used.
× ![]()


