

【Yesterday 2024.11.23 Swiss Franc to Yen】Look for signs of a rebound near the moving average that is being watched
【Mastering RCI!! Trend Reversal, Buy-the-D dips, Sell-the-Rallies】
Indicator 【BODSOR・mBDSR】 that shines in combination with RCI
Methods and Case Studies (PDF) ★GogoJungle AWARD2020 winner★
https://www.gogojungle.co.jp/tools/indicators/11836
Swiss Franc/Yen CHFJPY 1-minute chart
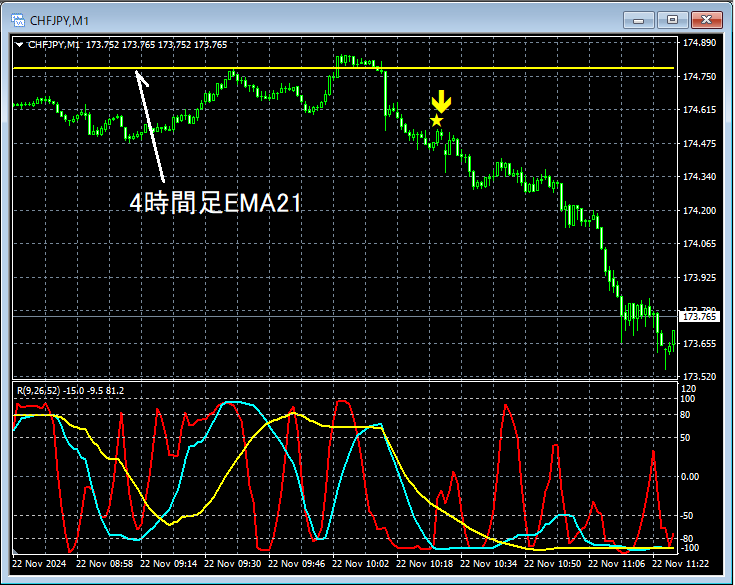
The higher-timeframe situation is omitted, but this is an aspect that is considered important in this case4-hour EMA21It has risen close to this level, and it might not be strange to look for a pullback sell.4-hour EMA21We will watch the chart for any signs of reversal around this vicinity.
Looking at the 1-minute chart above4-hour EMA21cannot clearly be surpassed and appears to be turning down. AndmBDSR (RCI two-line filter) sell signallights up and the price declines.
From this example,a trading method that focuses on reversals at moving averagesandthe signal of mBDSRshow strong compatibility.
※ Please note that in charts referenced in this article, circles, lines, rectangles, etc. may be drawn for convenience of explanation.
Indicator that shines in combination with RCI 【BODSOR・mBDSR】
Methods and Case Studies (PDF) ★GogoJungle AWARD2020 winner★
https://www.gogojungle.co.jp/tools/indicators/11836
The PDF file includes 358 items (over 1,400 pages, over 470,000 characters in total).
Many of them are designed to logically link higher and lower timeframes using RCI3 lines, examining multiple lower-timeframe conditions sequentially, and ultimately waiting for timing to buy on dips or sell on rallies at the lower timeframes (i.e., mBDSR signals).
Additionally,there is a strong emphasis on identifying points where multiple entry reasons coincide.
Note also,there are methods that explore upward and downward targets using the RCI3-lineas well.
In the PDF explanations,over 1,350 chartsare used.

Indicator 【BODSOR・mBDSR】 that shines in combination with RCI
Methods and Case Studies (PDF) ★GogoJungle AWARD2020 winner★
https://www.gogojungle.co.jp/tools/indicators/11836
Swiss Franc/Yen CHFJPY 1-minute chart
The higher-timeframe situation is omitted, but this is an aspect that is considered important in this case4-hour EMA21It has risen close to this level, and it might not be strange to look for a pullback sell.4-hour EMA21We will watch the chart for any signs of reversal around this vicinity.
Looking at the 1-minute chart above4-hour EMA21cannot clearly be surpassed and appears to be turning down. AndmBDSR (RCI two-line filter) sell signallights up and the price declines.
From this example,a trading method that focuses on reversals at moving averagesandthe signal of mBDSRshow strong compatibility.
※ Please note that in charts referenced in this article, circles, lines, rectangles, etc. may be drawn for convenience of explanation.
Indicator that shines in combination with RCI 【BODSOR・mBDSR】
Methods and Case Studies (PDF) ★GogoJungle AWARD2020 winner★
https://www.gogojungle.co.jp/tools/indicators/11836
The PDF file includes 358 items (over 1,400 pages, over 470,000 characters in total).
Many of them are designed to logically link higher and lower timeframes using RCI3 lines, examining multiple lower-timeframe conditions sequentially, and ultimately waiting for timing to buy on dips or sell on rallies at the lower timeframes (i.e., mBDSR signals).
Additionally,there is a strong emphasis on identifying points where multiple entry reasons coincide.
Note also,there are methods that explore upward and downward targets using the RCI3-lineas well.
In the PDF explanations,over 1,350 chartsare used.
× ![]()


