

【Good risk-reward high-conviction trade】Resist-support reversal line and mBDSR (RCI 2-line filter) pullback buy signal
【Master RCI!! Trend Reversal, Buy on Dips, Sell on Rallies】
Indicator【BODSOR・mBDSR】that shines when combined with RCI
Methods・Case Studies (PDF) ★GogoJungle AWARD2020 Winner★
https://www.gogojungle.co.jp/tools/indicators/11836
AUD/USD 1-hour chart
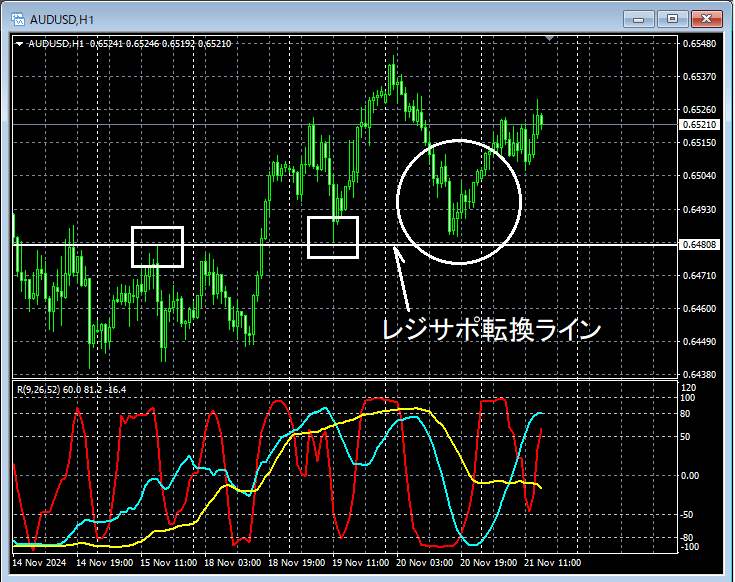
Looking at the area circled in white on the 1-hour chart above,it has approached horizontal levels that have historically acted as resistance or support (support-turned-resistance line)and it may well rebound at least temporarily from nearby levels.
AUD/USD 15-minute chart
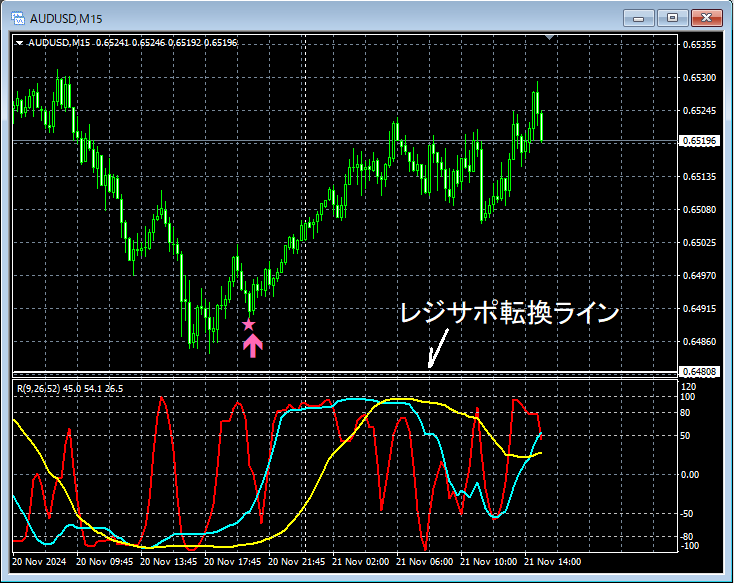
On the 15-minute chart above,the horizontal lines that have historically acted as resistance or support (support-turned-resistance lines)nearbymBDSR (Filter: RCI26 and RCI52) dip-buy signallights up, and prices rise solidly immediately afterward.
From this example,the trading method focused on support/resistance turned lines (horizontal lines)and the high compatibility withmBDSR signalsis evident.
Also, in this example, placing the stop-loss slightly below the most recent lowallows for a high reward-to-risk, favorable tradeopportunity.
※Please note that for readability, the charts shown in this article may include added circles, lines, or boxes.
Indicator【BODSOR・mBDSR】that shines when combined with RCI
Methods・Case Studies (PDF) ★GogoJungle AWARD2020 Winner★
https://www.gogojungle.co.jp/tools/indicators/11836
The PDF file includes 358 items (over 1,400 pages, over 470,000 characters in total).
Many of them aresummaries of examples where logical linking of higher and lower timeframes is accomplished using the three-RCI lines, leading to a sequence of examining multiple lower timeframes and ultimately waiting for dip-buy or pullback sell timing (i.e., mBDSR signals) on the lower timeframe.
Also,many focus on identifying points where multiple entry reasons align..
Additionally,there are methods for exploring upward or downward targets using the three-RCI lines..
In the PDF explanations,more than 1,350 chartsare used.

Indicator【BODSOR・mBDSR】that shines when combined with RCI
Methods・Case Studies (PDF) ★GogoJungle AWARD2020 Winner★
https://www.gogojungle.co.jp/tools/indicators/11836
AUD/USD 1-hour chart
Looking at the area circled in white on the 1-hour chart above,it has approached horizontal levels that have historically acted as resistance or support (support-turned-resistance line)and it may well rebound at least temporarily from nearby levels.
AUD/USD 15-minute chart
On the 15-minute chart above,the horizontal lines that have historically acted as resistance or support (support-turned-resistance lines)nearbymBDSR (Filter: RCI26 and RCI52) dip-buy signallights up, and prices rise solidly immediately afterward.
From this example,the trading method focused on support/resistance turned lines (horizontal lines)and the high compatibility withmBDSR signalsis evident.
Also, in this example, placing the stop-loss slightly below the most recent lowallows for a high reward-to-risk, favorable tradeopportunity.
※Please note that for readability, the charts shown in this article may include added circles, lines, or boxes.
Indicator【BODSOR・mBDSR】that shines when combined with RCI
Methods・Case Studies (PDF) ★GogoJungle AWARD2020 Winner★
https://www.gogojungle.co.jp/tools/indicators/11836
The PDF file includes 358 items (over 1,400 pages, over 470,000 characters in total).
Many of them aresummaries of examples where logical linking of higher and lower timeframes is accomplished using the three-RCI lines, leading to a sequence of examining multiple lower timeframes and ultimately waiting for dip-buy or pullback sell timing (i.e., mBDSR signals) on the lower timeframe.
Also,many focus on identifying points where multiple entry reasons align..
Additionally,there are methods for exploring upward or downward targets using the three-RCI lines..
In the PDF explanations,more than 1,350 chartsare used.
× ![]()


