

[Today 2024.11.19 CAD/JPY] Looking for signs of a rebound around the moving average line we are watching closely
【Mastering RCI!! Trend Reversal, Buy Dips, Sell Rallies】
Indicator that shines in combination with RCI: 【BODSOR・mBDSR】
Methods and Case Studies (PDF) ★GogoJungle AWARD2020 winner★
https://www.gogojungle.co.jp/tools/indicators/11836
Canadian Dollar / Japanese Yen CADJPY 15-minute chart
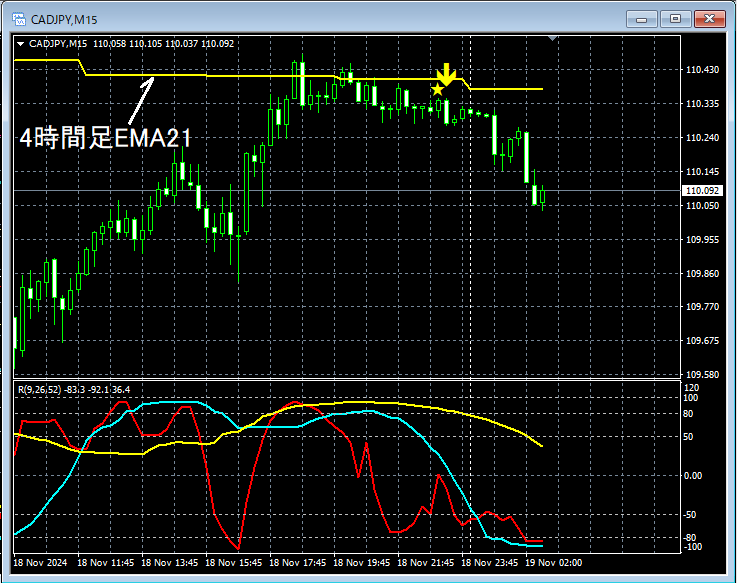
The higher timeframe chart is omitted, but it previously functioned as support and resistance4-hour EMA21has risen close to this area, making it not unusual to aim for selling on a pullback. We will watch the chart for signs of reversal around the moving average we deem important (in this case4-hour EMA21) for any signs of reversal.
Looking at the 15-minute chart above,4-hour EMA21could not be surpassedmBDSR (RCI two-filter) sell signallights up and the price moves downward.
From this example,a trading method focused on reversals at moving averagesandthe signals of mBDSRshow strong compatibility.
※Please note that in the charts introduced in this article, circles, lines, and boxes may be added for readability.
Indicator that shines in combination with RCI: 【BODSOR・mBDSR】
Methods and Case Studies (PDF) ★GogoJungle AWARD2020 winner★
https://www.gogojungle.co.jp/tools/indicators/11836
The PDF file includes 358 files (over 1,400 pages, over 470,000 characters).
Most of them are designed to logically link the higher and lower timeframes using three RCI lines, progressively examining multiple lower-timeframe conditions, and ultimately waiting for the timing of pullbacks on the lower timeframe (i.e., the mBDSR signals).
Additionally,many focus on identifying points where multiple entry reasons overlap.There are many more of these.
Furthermore,it also includes methods for exploring upside targets and downside targets using three RCI lines..
In the PDF explanations,more than 1,350 chartsare used.

Indicator that shines in combination with RCI: 【BODSOR・mBDSR】
Methods and Case Studies (PDF) ★GogoJungle AWARD2020 winner★
https://www.gogojungle.co.jp/tools/indicators/11836
Canadian Dollar / Japanese Yen CADJPY 15-minute chart
The higher timeframe chart is omitted, but it previously functioned as support and resistance4-hour EMA21has risen close to this area, making it not unusual to aim for selling on a pullback. We will watch the chart for signs of reversal around the moving average we deem important (in this case4-hour EMA21) for any signs of reversal.
Looking at the 15-minute chart above,4-hour EMA21could not be surpassedmBDSR (RCI two-filter) sell signallights up and the price moves downward.
From this example,a trading method focused on reversals at moving averagesandthe signals of mBDSRshow strong compatibility.
※Please note that in the charts introduced in this article, circles, lines, and boxes may be added for readability.
Indicator that shines in combination with RCI: 【BODSOR・mBDSR】
Methods and Case Studies (PDF) ★GogoJungle AWARD2020 winner★
https://www.gogojungle.co.jp/tools/indicators/11836
The PDF file includes 358 files (over 1,400 pages, over 470,000 characters).
Most of them are designed to logically link the higher and lower timeframes using three RCI lines, progressively examining multiple lower-timeframe conditions, and ultimately waiting for the timing of pullbacks on the lower timeframe (i.e., the mBDSR signals).
Additionally,many focus on identifying points where multiple entry reasons overlap.There are many more of these.
Furthermore,it also includes methods for exploring upside targets and downside targets using three RCI lines..
In the PDF explanations,more than 1,350 chartsare used.
× ![]()


