

[Today 2024.11.18 USD/JPY] Counter-trend line and mBDSR (RCI 2-line filter) pullback buy signal
【Mastering RCI!! Trend Reversal, Buy on Dips, and Sell on Rallies】
Indicator that shines when combined with RCI: 【BODSOR・mBDSR】
Methods and Case Studies (PDF) ★GogoJungle AWARD2020 Winner★
https://www.gogojungle.co.jp/tools/indicators/11836
USD/JPY 1-minute chart
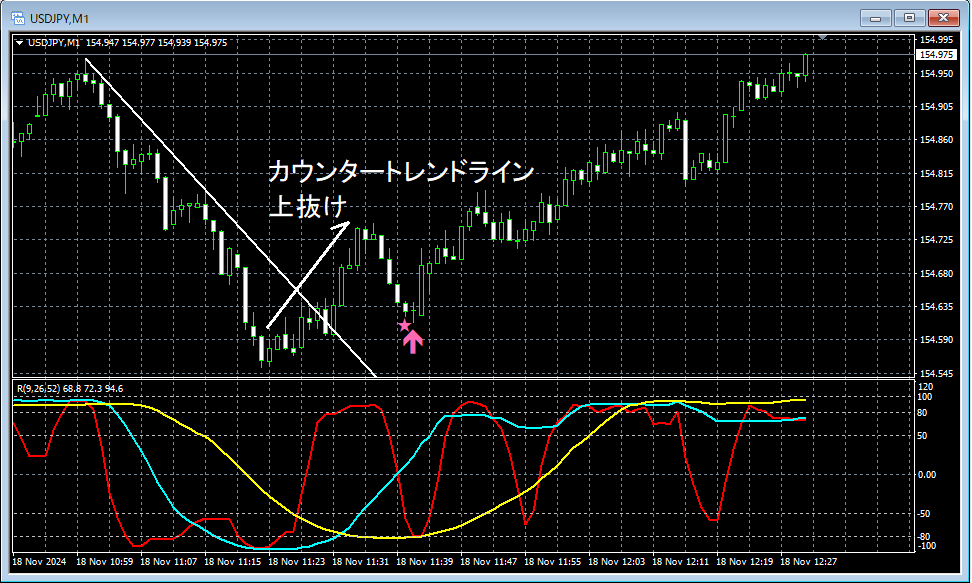
On the above 1-minute bar,a breakout above the Counter Trend Linethen a pullback withmBDSR (RCI two-line filter)buy-the-dip signal lights up, and subsequently price rises smoothly.
From this example,the trading method focused on the Counter Trend Lineandthe signals of mBDSRshow a strong compatibility.
*Please note that in the charts introduced in this article, for convenience of explanation, circles, lines, squares, etc. may be drawn.
Indicator that shines when combined with RCI【BODSOR・mBDSR】
Methods and Case Studies (PDF) ★GogoJungle AWARD2020 Winner★
https://www.gogojungle.co.jp/tools/indicators/11836
The PDF file contains 358 pieces (over 1,400 pages, over 470,000 characters).
Many of them are about logically linking higher and lower timeframes using three RCI lines, sequentially examining the conditions of multiple lower timeframes, and ultimately waiting for a dip-buy or rally-sell timing (i.e., mBDSR signals) on the lower timeframeThis is the gist of the collection.
Additionally,many entries emphasize identifying points where multiple entry criteria coincide.
Furthermore,it also includes methods to explore upside potential and downside potential using three RCI lines.
In the PDF explanations,more than 1,350 chartsare used.

Indicator that shines when combined with RCI: 【BODSOR・mBDSR】
Methods and Case Studies (PDF) ★GogoJungle AWARD2020 Winner★
https://www.gogojungle.co.jp/tools/indicators/11836
USD/JPY 1-minute chart
On the above 1-minute bar,a breakout above the Counter Trend Linethen a pullback withmBDSR (RCI two-line filter)buy-the-dip signal lights up, and subsequently price rises smoothly.
From this example,the trading method focused on the Counter Trend Lineandthe signals of mBDSRshow a strong compatibility.
*Please note that in the charts introduced in this article, for convenience of explanation, circles, lines, squares, etc. may be drawn.
Indicator that shines when combined with RCI【BODSOR・mBDSR】
Methods and Case Studies (PDF) ★GogoJungle AWARD2020 Winner★
https://www.gogojungle.co.jp/tools/indicators/11836
The PDF file contains 358 pieces (over 1,400 pages, over 470,000 characters).
Many of them are about logically linking higher and lower timeframes using three RCI lines, sequentially examining the conditions of multiple lower timeframes, and ultimately waiting for a dip-buy or rally-sell timing (i.e., mBDSR signals) on the lower timeframeThis is the gist of the collection.
Additionally,many entries emphasize identifying points where multiple entry criteria coincide.
Furthermore,it also includes methods to explore upside potential and downside potential using three RCI lines.
In the PDF explanations,more than 1,350 chartsare used.
× ![]()


