

[Today 2024.11.18 Euro New Zealand] Counter trend line and mBDSR (RCI with 2 lines filter) pullback buying signal
【Mastering RCI!! Trend Reversal, Buy the Dip, Sell the Rally】
Indicator that shines in combination with RCI: 【BODSOR・mBDSR】
and methods and case studies (PDF) ★GogoJungle AWARD2020 winner★
https://www.gogojungle.co.jp/tools/indicators/11836
EUR/NZD Euro/NZD 15-minute chart
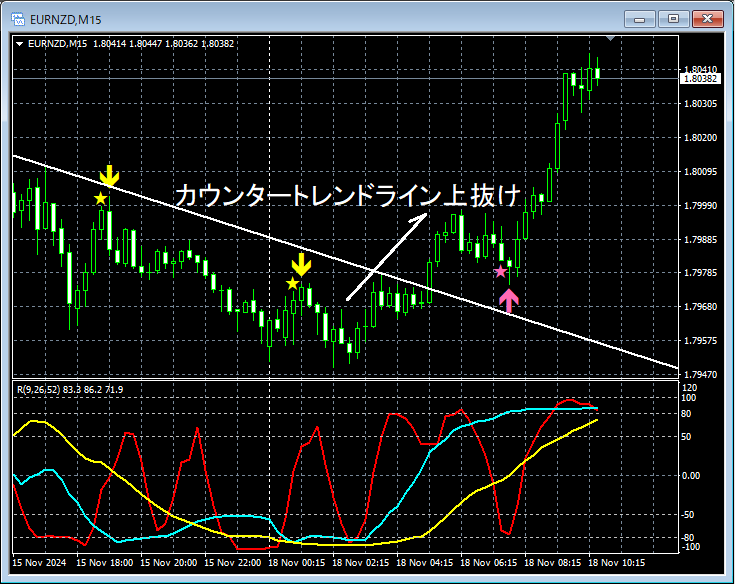
In the 15-minute chart above,counter-trend lineis broken to the upside, and in the subsequent declinemBDSR (RCI two-line filter)buy-the-dip signal lights up, and prices subsequently rise steadily.
From this example,a trading approach focused on the counter-trend lineandthe signals of mBDSRshow strong compatibility.
※Please note that in the charts introduced in this article, for convenience of explanation, circles, lines, and rectangles may be drawn.
Indicator that shines in combination with RCI: 【BODSOR・mBDSR】
and methods and case studies (PDF) ★GogoJungle AWARD2020 winner★
https://www.gogojungle.co.jp/tools/indicators/11836
The PDF file contains 358 files (over 1,400 pages, more than 470,000 characters).
Many of them areexamples that use the three-line RCI to logically link higher and lower timeframes, sequentially analyzing multiple lower timeframes, and ultimately waiting for buy-the-dip or sell-the-rally timing (i.e., mBDSR signals) on the lower timeframe.This is the gist of those examples.
Also,many focus on capturing points where multiple entry reasons overlap.There are also many such cases.
Additionally,the method of exploring upside and downside targets using three-line RCI is included.Also included.
In the PDF explanations,more than 1,350 chartsare used.

Indicator that shines in combination with RCI: 【BODSOR・mBDSR】
and methods and case studies (PDF) ★GogoJungle AWARD2020 winner★
https://www.gogojungle.co.jp/tools/indicators/11836
EUR/NZD Euro/NZD 15-minute chart
In the 15-minute chart above,counter-trend lineis broken to the upside, and in the subsequent declinemBDSR (RCI two-line filter)buy-the-dip signal lights up, and prices subsequently rise steadily.
From this example,a trading approach focused on the counter-trend lineandthe signals of mBDSRshow strong compatibility.
※Please note that in the charts introduced in this article, for convenience of explanation, circles, lines, and rectangles may be drawn.
Indicator that shines in combination with RCI: 【BODSOR・mBDSR】
and methods and case studies (PDF) ★GogoJungle AWARD2020 winner★
https://www.gogojungle.co.jp/tools/indicators/11836
The PDF file contains 358 files (over 1,400 pages, more than 470,000 characters).
Many of them areexamples that use the three-line RCI to logically link higher and lower timeframes, sequentially analyzing multiple lower timeframes, and ultimately waiting for buy-the-dip or sell-the-rally timing (i.e., mBDSR signals) on the lower timeframe.This is the gist of those examples.
Also,many focus on capturing points where multiple entry reasons overlap.There are also many such cases.
Additionally,the method of exploring upside and downside targets using three-line RCI is included.Also included.
In the PDF explanations,more than 1,350 chartsare used.
× ![]()


