

[From the latest Gold XAUUSD chart] RCI three lines, break of support, and mBDSR pullback sell signal
【Mastering RCI!! Trend Reversal, Buy on Dips, Sell on Rallies】
Indicator 【BODSOR・mBDSR】 that exerts power when combined with RCI
Methods and Case Studies (PDF) ★GogoJungle AWARD2020 recipient★
https://www.gogojungle.co.jp/tools/indicators/11836
GOLD XAUUSD 4-hour chart
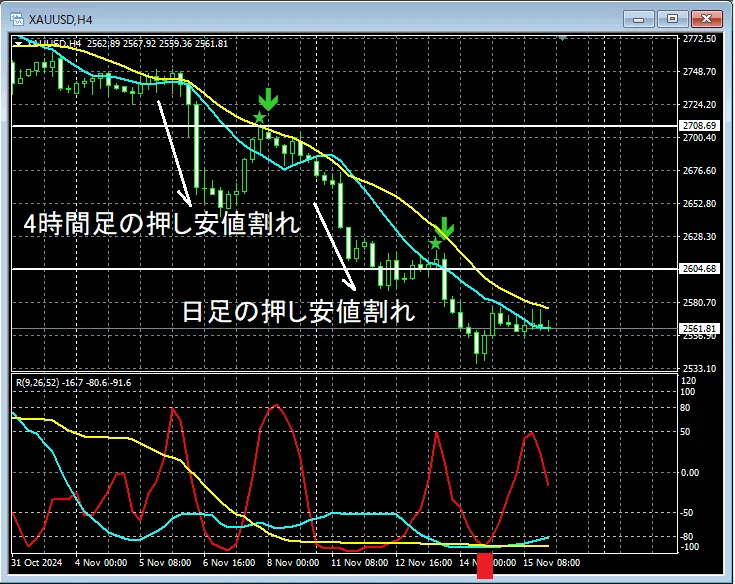
The upper-timeframe situation is omitted. Also,RCI three-lineis used to drill down from the higher timeframe to the lower timeframe, and in the lower timeframe (in this example, the 4-hour chart)mBDSR signalis waited for. Details are provided in the accompanying PDF, so it is omitted here.
On the 4-hour chart above, firstly,the 4-hour pullback lowis broken to the downside, and then the risemBDSR (Moving Average Filter)sell signal lights up, and the price declines. After that,the daily pullback lowis broken to the downside, and on the subsequent risemBDSR (Moving Average Filter)sell signal lights up, and the price declines further. Also,RCI three-lineshows a so-calledRCI triple bottomshape (around the red square) as it drops.
From this example,the high compatibility between trading methods that focus on RCI three lines and Dow TheoryandmBDSR signalsis evident.
※Please note that the charts introduced in this article may have circles, lines, and squares added for explanatory convenience.
Indicator 【BODSOR・mBDSR】 that shows power when combined with RCI
Methods and Case Studies (PDF) ★GogoJungle AWARD2020 recipient★
https://www.gogojungle.co.jp/tools/indicators/11836
The PDF file includes 358 items (over 1,400 pages, over 470,000 characters).
Many of them describe how to logically link higher and lower timeframes using the RCI three-line, sequentially examining multiple lower-timeframe conditions, and finally waiting for the pullback buy or the pullback sell timing (i.e., mBDSR signals) in the lower timeframe.
Additionally,there are many that focus on identifying points where multiple entry reasons overlap..
Also included are methods for exploring upward and downward targets using the RCI three-line.
In the PDF explanations,more than 1,350 chartsare used.

Indicator 【BODSOR・mBDSR】 that exerts power when combined with RCI
Methods and Case Studies (PDF) ★GogoJungle AWARD2020 recipient★
https://www.gogojungle.co.jp/tools/indicators/11836
GOLD XAUUSD 4-hour chart
The upper-timeframe situation is omitted. Also,RCI three-lineis used to drill down from the higher timeframe to the lower timeframe, and in the lower timeframe (in this example, the 4-hour chart)mBDSR signalis waited for. Details are provided in the accompanying PDF, so it is omitted here.
On the 4-hour chart above, firstly,the 4-hour pullback lowis broken to the downside, and then the risemBDSR (Moving Average Filter)sell signal lights up, and the price declines. After that,the daily pullback lowis broken to the downside, and on the subsequent risemBDSR (Moving Average Filter)sell signal lights up, and the price declines further. Also,RCI three-lineshows a so-calledRCI triple bottomshape (around the red square) as it drops.
From this example,the high compatibility between trading methods that focus on RCI three lines and Dow TheoryandmBDSR signalsis evident.
※Please note that the charts introduced in this article may have circles, lines, and squares added for explanatory convenience.
Indicator 【BODSOR・mBDSR】 that shows power when combined with RCI
Methods and Case Studies (PDF) ★GogoJungle AWARD2020 recipient★
https://www.gogojungle.co.jp/tools/indicators/11836
The PDF file includes 358 items (over 1,400 pages, over 470,000 characters).
Many of them describe how to logically link higher and lower timeframes using the RCI three-line, sequentially examining multiple lower-timeframe conditions, and finally waiting for the pullback buy or the pullback sell timing (i.e., mBDSR signals) in the lower timeframe.
Additionally,there are many that focus on identifying points where multiple entry reasons overlap..
Also included are methods for exploring upward and downward targets using the RCI three-line.
In the PDF explanations,more than 1,350 chartsare used.
× ![]()


