

[Yesterday 2024.11.15 of AO Canada] Break above the retracement high on the lower timeframe and mBDSR (RCI 2-line filter) pullback buying signal
【Mastering RCI!! Trend Reversal, Buy the Dip, Sell the Rally】
Indicator that shines when combined with RCI【BODSOR・mBDSR】
and methodology・case studies (PDF) ★GogoJungle AWARD2020 winner★
https://www.gogojungle.co.jp/tools/indicators/11836
AUD/USD / CAD USD 1-hour timeframe
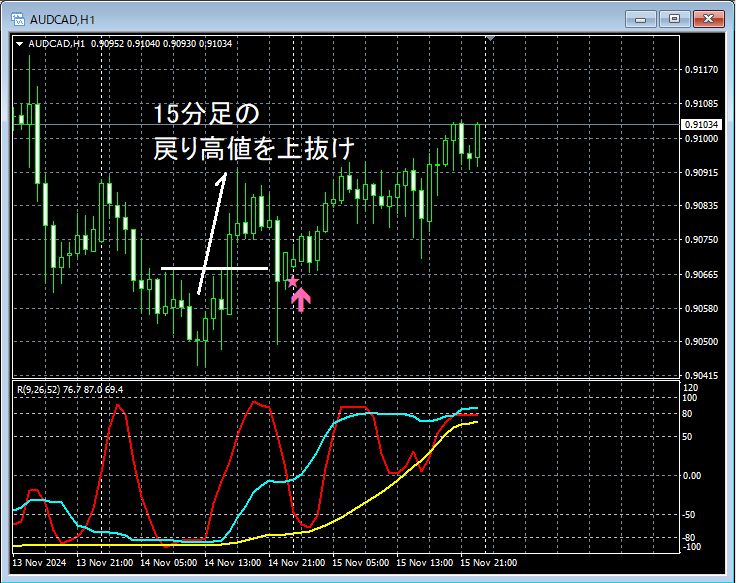
The status of the higher timeframe is omitted. On the 1-hour timeframe above,the dip-buying signal on the lower timeframe (15-minute chart) after breaking above the previous highis lit bymBDSR (two RCI lines filter)and subsequently prices have risen.
From this example,the trade method focusing on Dow Theoryandthe signals of mBDSRshow high compatibility.
*Please note that the charts introduced in this article may have added circles, straight lines, squares, etc. for clarity.
Indicator that shines when combined with RCI【BODSOR・mBDSR】
and methodology・case studies (PDF) ★GogoJungle AWARD2020 winner★
https://www.gogojungle.co.jp/tools/indicators/11836
The PDF file includes 358 files (over 1,400 pages, over 470,000 characters in total).
Many of them aresummaries of how to logically link higher and lower timeframes using the RCI 3-line with the aim of sequentially examining multiple lower-timeframe conditions and ultimately waiting for the dip-buying timing or rally-selling timing on the lower timeframe (i.e., the mBDSR signal)..
Also,many entries focus on identifying points where multiple entry reasons overlap.
Furthermore,there are methods for exploring upside and downside targets using the RCI 3-lineas well.
In the explanations within the PDF filesmore than 1,350 charts are used.

Indicator that shines when combined with RCI【BODSOR・mBDSR】
and methodology・case studies (PDF) ★GogoJungle AWARD2020 winner★
https://www.gogojungle.co.jp/tools/indicators/11836
AUD/USD / CAD USD 1-hour timeframe
The status of the higher timeframe is omitted. On the 1-hour timeframe above,the dip-buying signal on the lower timeframe (15-minute chart) after breaking above the previous highis lit bymBDSR (two RCI lines filter)and subsequently prices have risen.
From this example,the trade method focusing on Dow Theoryandthe signals of mBDSRshow high compatibility.
*Please note that the charts introduced in this article may have added circles, straight lines, squares, etc. for clarity.
Indicator that shines when combined with RCI【BODSOR・mBDSR】
and methodology・case studies (PDF) ★GogoJungle AWARD2020 winner★
https://www.gogojungle.co.jp/tools/indicators/11836
The PDF file includes 358 files (over 1,400 pages, over 470,000 characters in total).
Many of them aresummaries of how to logically link higher and lower timeframes using the RCI 3-line with the aim of sequentially examining multiple lower-timeframe conditions and ultimately waiting for the dip-buying timing or rally-selling timing on the lower timeframe (i.e., the mBDSR signal)..
Also,many entries focus on identifying points where multiple entry reasons overlap.
Furthermore,there are methods for exploring upside and downside targets using the RCI 3-lineas well.
In the explanations within the PDF filesmore than 1,350 charts are used.
× ![]()


