

【Yesterday 2024.11.15 New Zealand Canada】Break above the lower-timeframe recovery high, double bottom, and mBDSR (RCI two-filter) pullback buying signal
【Mastering RCI!! Trend Reversal, Buy the Dip, Sell the Rally】
Indicator【BODSOR・mBDSR】that shines when combined with RCI
Methods, and Case Studies (PDF) ★GogoJungle AWARD2020 winner★
https://www.gogojungle.co.jp/tools/indicators/11836
NZD/CAD 1-hour chart
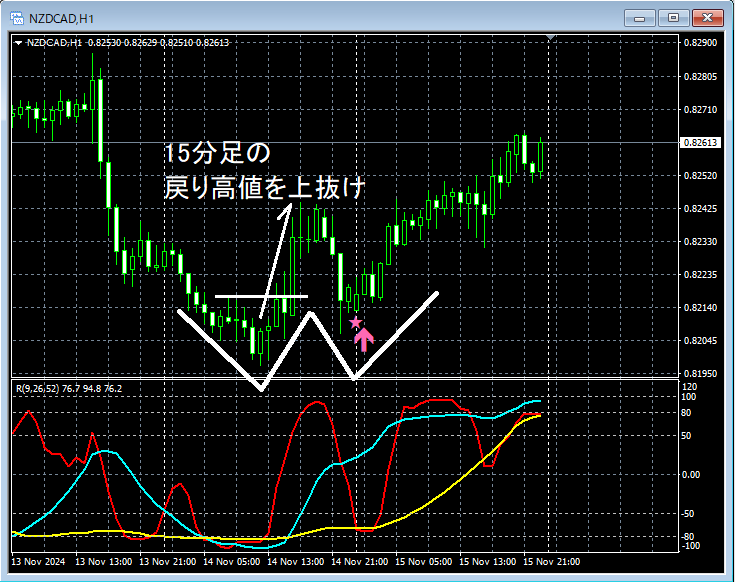
Regarding the higher timeframe, omitted. On the 1-hour chart above,the lower timeframe (15-minute chart) breakout of the high of the pullbackafter the move upwardmBDSR(2-RCI filters)pullback buy signal lights up, and price subsequently rises smoothly. As a resultdouble bottomat the right-hand valleymBDSR(2-RCI filters)pullback buy signal lights up.
From this example,the high compatibility between Dow Theory or double bottoms trading methodsandthe mBDSR signalsis evident.
※Please note that in the charts shown in this article, circles, lines, and rectangles may be drawn for explanatory convenience.
Indicator【BODSOR・mBDSR】that shines when combined with RCI
Methods, and Case Studies (PDF) ★GogoJungle AWARD2020 winner★
https://www.gogojungle.co.jp/tools/indicators/11836
The PDF file includes 358 files (over 1,400 pages, over 470,000 characters).
Many of these are summaries of examples where multiple lower-timeframe conditions are logically linked to higher-timeframes using three RCI lines, and ultimately wait for pullback buys or pullback sells (i.e., mBDSR signals) on the lower timeframes.
Additionally,many focus on identifying points where multiple entry reasons overlap.Also included is a method to explore upside and downside targets using three RCI lines.
In the PDF explanations,more than 1,350 charts
are used.

Indicator【BODSOR・mBDSR】that shines when combined with RCI
Methods, and Case Studies (PDF) ★GogoJungle AWARD2020 winner★
https://www.gogojungle.co.jp/tools/indicators/11836
NZD/CAD 1-hour chart
Regarding the higher timeframe, omitted. On the 1-hour chart above,the lower timeframe (15-minute chart) breakout of the high of the pullbackafter the move upwardmBDSR(2-RCI filters)pullback buy signal lights up, and price subsequently rises smoothly. As a resultdouble bottomat the right-hand valleymBDSR(2-RCI filters)pullback buy signal lights up.
From this example,the high compatibility between Dow Theory or double bottoms trading methodsandthe mBDSR signalsis evident.
※Please note that in the charts shown in this article, circles, lines, and rectangles may be drawn for explanatory convenience.
Indicator【BODSOR・mBDSR】that shines when combined with RCI
Methods, and Case Studies (PDF) ★GogoJungle AWARD2020 winner★
https://www.gogojungle.co.jp/tools/indicators/11836
The PDF file includes 358 files (over 1,400 pages, over 470,000 characters).
Many of these are summaries of examples where multiple lower-timeframe conditions are logically linked to higher-timeframes using three RCI lines, and ultimately wait for pullback buys or pullback sells (i.e., mBDSR signals) on the lower timeframes.
Additionally,many focus on identifying points where multiple entry reasons overlap.Also included is a method to explore upside and downside targets using three RCI lines.
In the PDF explanations,more than 1,350 charts
are used.
× ![]()


