

[Yesterday 2024.11.15 USD/JPY] Triple top (head and shoulders) and mBDSR (RCI two-filter) return-sell signal
【Mastering RCI!! Trend Reversal, Buy on Dips, Buy on Rallies】
Indicator【BODSOR・mBDSR】that exerts power in combination with RCI
Methods and Case Studies (PDF) ★GogoJungle AWARD2020 Winner★
https://www.gogojungle.co.jp/tools/indicators/11836
USDJPY 15-minute chart
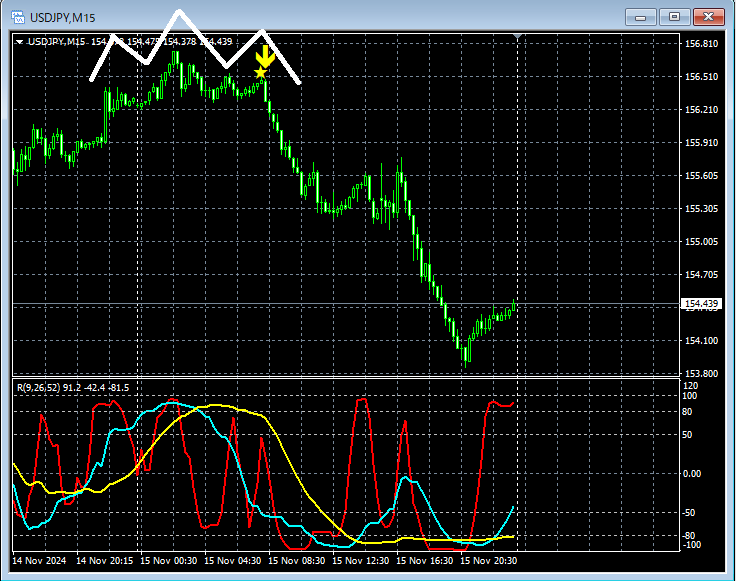
On the 15-minute chart above,mBDSR (Double RCI filter)buyback signal is lit, and price has been declining smoothly since. As a result,Head and Shouldersright shouldermBDSR (Double RCI filter)signal lighting up indicates the downward move.
From this example,a trading method focused on Head and Shouldersandthe harmony with mBDSR signalscan be seen to have high compatibility.
※ Please note that in the charts introduced in this article, for convenience of explanation, circles, straight lines, and rectangles may be drawn.
Indicator【BODSOR・mBDSR】that exerts power in combination with RCI
Methods and Case Studies (PDF) ★GogoJungle AWARD2020 Winner★
https://www.gogojungle.co.jp/tools/indicators/11836
The PDF file includes 358 items (over 1,400 pages, over 470,000 Japanese characters).
Most of them are summaries of cases where multiple timeframes are logically linked using three RCI lines to examine higher and lower timeframes sequentially, ultimately waiting for dips or pullbacks signals on the lower timeframe (i.e., mBDSR signals).
Also,many focus on identifying points where multiple entry reasons coincide.There are also many parts where
Additionally,a method exploring upside and downside targets using three RCI lines is included.
In the explanations within the PDF files,over 1,350 chartsare used.

Indicator【BODSOR・mBDSR】that exerts power in combination with RCI
Methods and Case Studies (PDF) ★GogoJungle AWARD2020 Winner★
https://www.gogojungle.co.jp/tools/indicators/11836
USDJPY 15-minute chart
On the 15-minute chart above,mBDSR (Double RCI filter)buyback signal is lit, and price has been declining smoothly since. As a result,Head and Shouldersright shouldermBDSR (Double RCI filter)signal lighting up indicates the downward move.
From this example,a trading method focused on Head and Shouldersandthe harmony with mBDSR signalscan be seen to have high compatibility.
※ Please note that in the charts introduced in this article, for convenience of explanation, circles, straight lines, and rectangles may be drawn.
Indicator【BODSOR・mBDSR】that exerts power in combination with RCI
Methods and Case Studies (PDF) ★GogoJungle AWARD2020 Winner★
https://www.gogojungle.co.jp/tools/indicators/11836
The PDF file includes 358 items (over 1,400 pages, over 470,000 Japanese characters).
Most of them are summaries of cases where multiple timeframes are logically linked using three RCI lines to examine higher and lower timeframes sequentially, ultimately waiting for dips or pullbacks signals on the lower timeframe (i.e., mBDSR signals).
Also,many focus on identifying points where multiple entry reasons coincide.There are also many parts where
Additionally,a method exploring upside and downside targets using three RCI lines is included.
In the explanations within the PDF files,over 1,350 chartsare used.
× ![]()


