

【Yesterday 2024.11.15 Dollar/Canadian】Break above the return high and MBDRS (RCI 2-line filter) pullback buying signal
【Mastering RCI!! Trend Reversal, Buying on Dips, Selling on Rallies】
Indicator 【BODSOR・mBDSR】 that shows its power in combination with RCI
and methods, case studies (PDF) ★GogoJungle AWARD2020 winner★
https://www.gogojungle.co.jp/tools/indicators/11836
US Dollar / Canadian Dollar USDCAD 15-minute chart
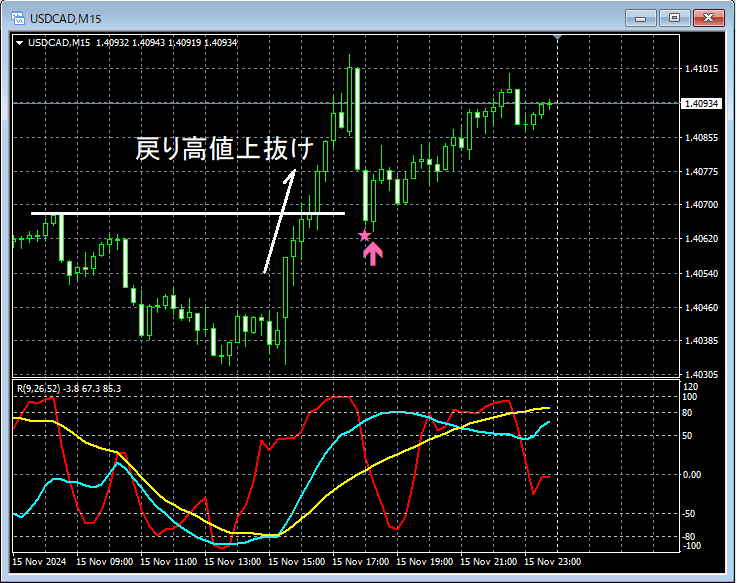
Regarding the higher time frame, omitted. On the 15-minute chart above,breakout of the swing highafter breaking above is followed by a drop wheremBDSR (2 RCI lines filter)buying the dip signal lights up, and subsequently, price has risen smoothly.
From this example,the trading method focused on Dow Theoryandthe synergy with mBDSR signalsare evident.
※ Please note that in the charts shown in this article, for convenience of explanation, circles, straight lines, and squares may be drawn.
Indicator 【BODSOR・mBDSR】 that shows its power in combination with RCI
and methods, case studies (PDF) ★GogoJungle AWARD2020 winner★
https://www.gogojungle.co.jp/tools/indicators/11836
The PDF file is included with 358 documents (over 1,400 pages, over 470,000 characters in total).
Most of them consist ofexamples that logically link higher and lower time frames using the three-line RCI, sequentially considering the status of multiple lower time frames, and ultimately waiting for dipping buy timing or rally selling timing (i.e., mBDSR signals) on the lower time frame.
In addition,many emphasize capturing points where multiple entry reasons overlap.
Moreover,there are also methods that explore upside and downside targets using three-line RCI.
In the explanations within the PDF files,more than 1,350 chartsare used.

Indicator 【BODSOR・mBDSR】 that shows its power in combination with RCI
and methods, case studies (PDF) ★GogoJungle AWARD2020 winner★
https://www.gogojungle.co.jp/tools/indicators/11836
US Dollar / Canadian Dollar USDCAD 15-minute chart
Regarding the higher time frame, omitted. On the 15-minute chart above,breakout of the swing highafter breaking above is followed by a drop wheremBDSR (2 RCI lines filter)buying the dip signal lights up, and subsequently, price has risen smoothly.
From this example,the trading method focused on Dow Theoryandthe synergy with mBDSR signalsare evident.
※ Please note that in the charts shown in this article, for convenience of explanation, circles, straight lines, and squares may be drawn.
Indicator 【BODSOR・mBDSR】 that shows its power in combination with RCI
and methods, case studies (PDF) ★GogoJungle AWARD2020 winner★
https://www.gogojungle.co.jp/tools/indicators/11836
The PDF file is included with 358 documents (over 1,400 pages, over 470,000 characters in total).
Most of them consist ofexamples that logically link higher and lower time frames using the three-line RCI, sequentially considering the status of multiple lower time frames, and ultimately waiting for dipping buy timing or rally selling timing (i.e., mBDSR signals) on the lower time frame.
In addition,many emphasize capturing points where multiple entry reasons overlap.
Moreover,there are also methods that explore upside and downside targets using three-line RCI.
In the explanations within the PDF files,more than 1,350 chartsare used.
× ![]()


