

The requested translation: [Yesterday 2024.11.15 Pound/Dollar] Head and shoulders and moving averages and mBDSR (RCI two-filters) retracement selling signal
【Mastering RCI!! Trend Reversal, Buy on Dips, Sell on Rallies】
An indicator that shines in combination with RCI【BODSOR・mBDSR】
Techniques and Case Studies (PDF) ★GogoJungle AWARD2020 Winner★
https://www.gogojungle.co.jp/tools/indicators/11836
Pound/Dollar GBPUSD 5-minute Chart
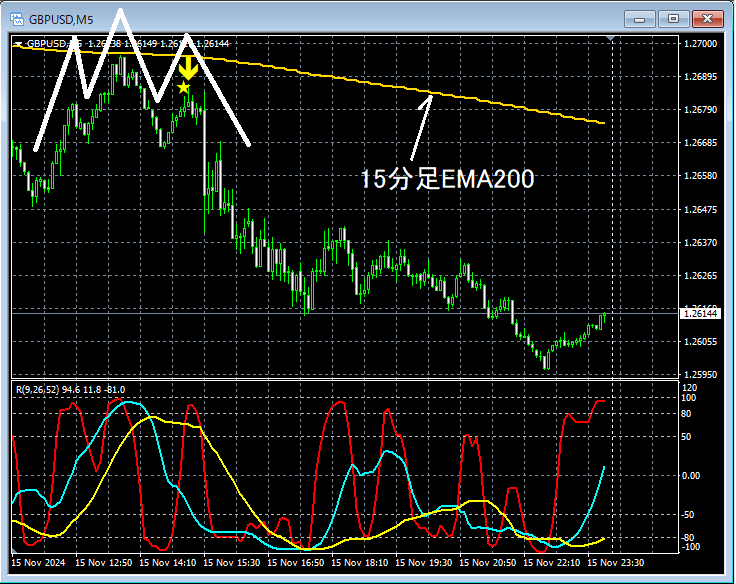
On the 5-minute chart above, the area that previously acted as resistancenear the 15-minute EMA200rises and then shows signs of reversal. After that,mBDSR (RCI two-line filter)sell signal appears, and price has been steadily moving downward. As a resultHead and Shoulderson the right shouldermBDSR (RCI two-line filter)signal lights up and price continues lower.
From this example,a trading approach focused on Head and Shoulders and moving averagesandthe signals of mBDSRshow strong compatibility.
※Please note that the charts shown in this article may include added circles, lines, or rectangles for explanatory convenience.
Indicator that shines in combination with RCI【BODSOR・mBDSR】
Techniques and Case Studies (PDF) ★GogoJungle AWARD2020 Winner★
https://www.gogojungle.co.jp/tools/indicators/11836
The PDF file includes 358 items (over 1,400 pages, over 470,000 characters).
Most of them are composed to examine multiple lower-timeframe conditions by logically linking higher and lower timeframes using three RCI lines, ultimately waiting for buy on dips or sell on rallies timing (i.e., mBDSR signals) on the lower timeframe.
Additionally,many focus on identifying points where multiple entry justifications overlap.There are also many that explore methods using three RCI lines to gauge upward and downward targets.
In the explanations within the PDF file,
more than 1,350 chartsare used.

An indicator that shines in combination with RCI【BODSOR・mBDSR】
Techniques and Case Studies (PDF) ★GogoJungle AWARD2020 Winner★
https://www.gogojungle.co.jp/tools/indicators/11836
Pound/Dollar GBPUSD 5-minute Chart
On the 5-minute chart above, the area that previously acted as resistancenear the 15-minute EMA200rises and then shows signs of reversal. After that,mBDSR (RCI two-line filter)sell signal appears, and price has been steadily moving downward. As a resultHead and Shoulderson the right shouldermBDSR (RCI two-line filter)signal lights up and price continues lower.
From this example,a trading approach focused on Head and Shoulders and moving averagesandthe signals of mBDSRshow strong compatibility.
※Please note that the charts shown in this article may include added circles, lines, or rectangles for explanatory convenience.
Indicator that shines in combination with RCI【BODSOR・mBDSR】
Techniques and Case Studies (PDF) ★GogoJungle AWARD2020 Winner★
https://www.gogojungle.co.jp/tools/indicators/11836
The PDF file includes 358 items (over 1,400 pages, over 470,000 characters).
Most of them are composed to examine multiple lower-timeframe conditions by logically linking higher and lower timeframes using three RCI lines, ultimately waiting for buy on dips or sell on rallies timing (i.e., mBDSR signals) on the lower timeframe.
Additionally,many focus on identifying points where multiple entry justifications overlap.There are also many that explore methods using three RCI lines to gauge upward and downward targets.
In the explanations within the PDF file,
more than 1,350 chartsare used.
× ![]()


