

[Yesterday 2024.11.15 Euro-Yen] Double top, moving average, and mBDSR (RCI two-line filter) selling signal return
【Mastering RCI!! Trend Reversal, Buy the Dip, Sell the Rallies】
Indicator that shines in combination with RCI【BODSOR・mBDSR】
Methods and Case Studies (PDF) ★GogoJungle AWARD2020 Winner★
https://www.gogojungle.co.jp/tools/indicators/11836
Euro/Yen EURJPY 30-minute chart
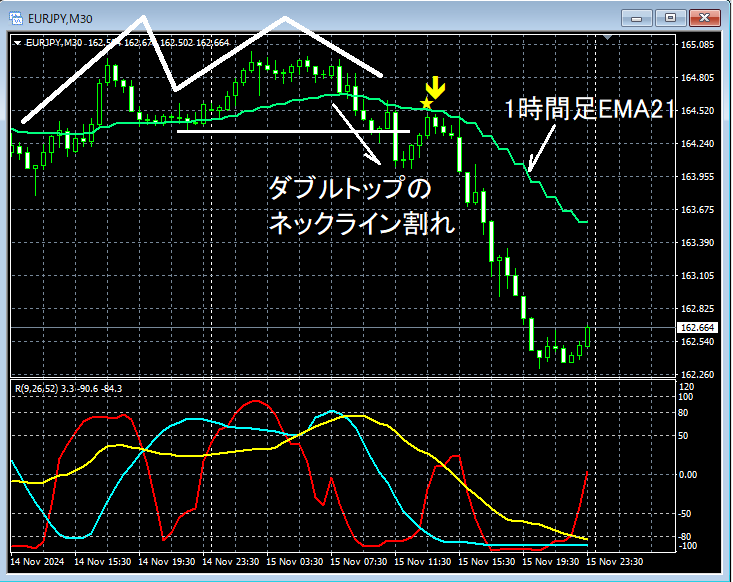
On the 30-minute chart above, what is considered important in this caseis the 1-hour EMA21breaking below,the neck line of the double topalso breaks below. After thatnear the 1-hour EMA21rises to a point wheremBDSR (RCI two-filter)sell signal appears, and price subsequently declines smoothly.
From this example,a trading method focusing on double tops and moving averagesandthe signals from mBDSRshow a high degree of synergy.
※Please note that in charts mentioned in this article, for convenience there may be additions such as circles, straight lines, or rectangles drawn.
Indicator that shines in combination with RCI【BODSOR・mBDSR】
Methods and Case Studies (PDF) ★GogoJungle AWARD2020 Winner★
https://www.gogojungle.co.jp/tools/indicators/11836
The PDF file includes 358 items (over 1,400 pages, over 470,000 characters).
Many of them areexamples that flesh out a form where multiple lower-timeframe conditions are logically linked to higher timeframes using three RCI lines, ultimately waiting for a dip buy or pullback sell timing (the mBDSR signals) on the lower timeframe..
Additionally,there are many that emphasize capturing points where multiple entry reasons coincide..
Furthermore,there are methods that explore upside and downside targets using three RCI lines..
In the PDF explanations,over 1,350 chartsare used.

Indicator that shines in combination with RCI【BODSOR・mBDSR】
Methods and Case Studies (PDF) ★GogoJungle AWARD2020 Winner★
https://www.gogojungle.co.jp/tools/indicators/11836
Euro/Yen EURJPY 30-minute chart
On the 30-minute chart above, what is considered important in this caseis the 1-hour EMA21breaking below,the neck line of the double topalso breaks below. After thatnear the 1-hour EMA21rises to a point wheremBDSR (RCI two-filter)sell signal appears, and price subsequently declines smoothly.
From this example,a trading method focusing on double tops and moving averagesandthe signals from mBDSRshow a high degree of synergy.
※Please note that in charts mentioned in this article, for convenience there may be additions such as circles, straight lines, or rectangles drawn.
Indicator that shines in combination with RCI【BODSOR・mBDSR】
Methods and Case Studies (PDF) ★GogoJungle AWARD2020 Winner★
https://www.gogojungle.co.jp/tools/indicators/11836
The PDF file includes 358 items (over 1,400 pages, over 470,000 characters).
Many of them areexamples that flesh out a form where multiple lower-timeframe conditions are logically linked to higher timeframes using three RCI lines, ultimately waiting for a dip buy or pullback sell timing (the mBDSR signals) on the lower timeframe..
Additionally,there are many that emphasize capturing points where multiple entry reasons coincide..
Furthermore,there are methods that explore upside and downside targets using three RCI lines..
In the PDF explanations,over 1,350 chartsare used.
× ![]()


