

[Yesterday 2024.11.15 Pound/Yen] Break of the local low and mBDSR (RCI 2-line filter) sell signal
【Mastering RCI!! Trend Reversals, Buy on Dips, Sell on Rallies】
Indicator that shines when combined with RCI【BODSOR・mBDSR】
Methods and Case Studies (PDF) ★GogoJungle AWARD2020 Winner★
https://www.gogojungle.co.jp/tools/indicators/11836
GBP/JPY 30-minute chart
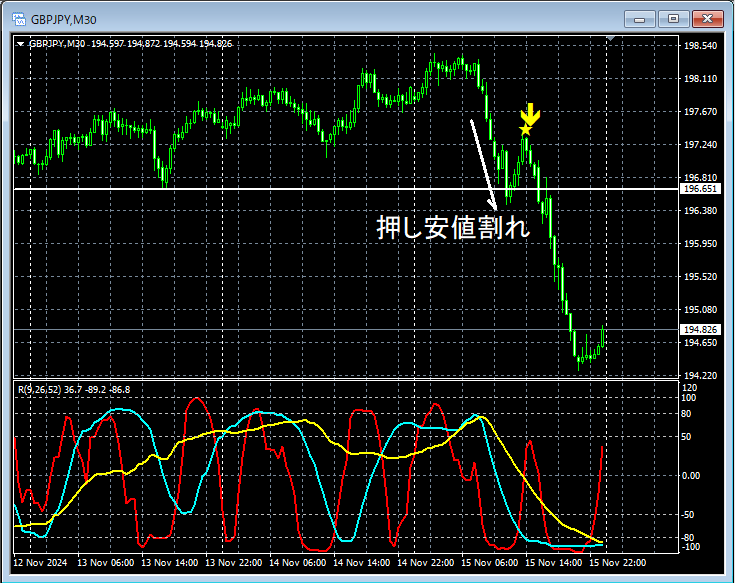
Regarding the higher timeframe, omitted. On the 30-minute chart above,the breakout below the swing lowsignals a rise,mBDSR (two RCI filters)sell signal lights up, and subsequently the price has been steadily declining.
From this example,a trading method focusing on Dow Theoryandthe signal from mBDSRshow strong compatibility.
※Please note that charts mentioned in this article may include added circles, lines, or boxes for explanatory convenience.
Indicator that shines when combined with RCI【BODSOR・mBDSR】
Methods and Case Studies (PDF) ★GogoJungle AWARD2020 Winner★
https://www.gogojungle.co.jp/tools/indicators/11836
The PDF file includes 358 items (over 1,400 pages, over 470,000 characters in total).
Most of these summarize examples where, by using three RCI lines to logically link higher and lower timeframes, multiple lower-timeframe conditions are examined sequentially, ultimately waiting for a dip-buy or pullback-sell timing (i.e., the mBDSR signal) on the lower timeframe.
Additionally,many focus on capturing points where multiple entry reasons converge.There are also many that include methods to explore upside and downside targets using three RCI lines.
In the PDF descriptions,
over 1,350 chartsare used.

Indicator that shines when combined with RCI【BODSOR・mBDSR】
Methods and Case Studies (PDF) ★GogoJungle AWARD2020 Winner★
https://www.gogojungle.co.jp/tools/indicators/11836
GBP/JPY 30-minute chart
Regarding the higher timeframe, omitted. On the 30-minute chart above,the breakout below the swing lowsignals a rise,mBDSR (two RCI filters)sell signal lights up, and subsequently the price has been steadily declining.
From this example,a trading method focusing on Dow Theoryandthe signal from mBDSRshow strong compatibility.
※Please note that charts mentioned in this article may include added circles, lines, or boxes for explanatory convenience.
Indicator that shines when combined with RCI【BODSOR・mBDSR】
Methods and Case Studies (PDF) ★GogoJungle AWARD2020 Winner★
https://www.gogojungle.co.jp/tools/indicators/11836
The PDF file includes 358 items (over 1,400 pages, over 470,000 characters in total).
Most of these summarize examples where, by using three RCI lines to logically link higher and lower timeframes, multiple lower-timeframe conditions are examined sequentially, ultimately waiting for a dip-buy or pullback-sell timing (i.e., the mBDSR signal) on the lower timeframe.
Additionally,many focus on capturing points where multiple entry reasons converge.There are also many that include methods to explore upside and downside targets using three RCI lines.
In the PDF descriptions,
over 1,350 chartsare used.
× ![]()


