

From the USD/JPY chart for today, 2024.11.13: Counter-trend line and mBDSR (RCI two-filter) pullback buy signal
Indicator that shines in combination with RCI: BODSOR and mBDSR
Method and Case Studies (PDF) ★GogoJungle AWARD 2020 Winner★
https://www.gogojungle.co.jp/tools/indicators/11836
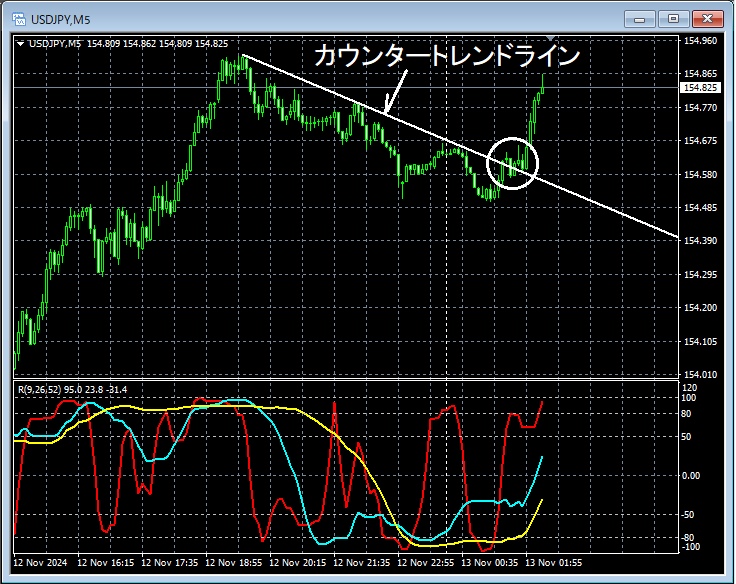
USD/JPY 5-minute chart
USD/JPY 1-minute chart
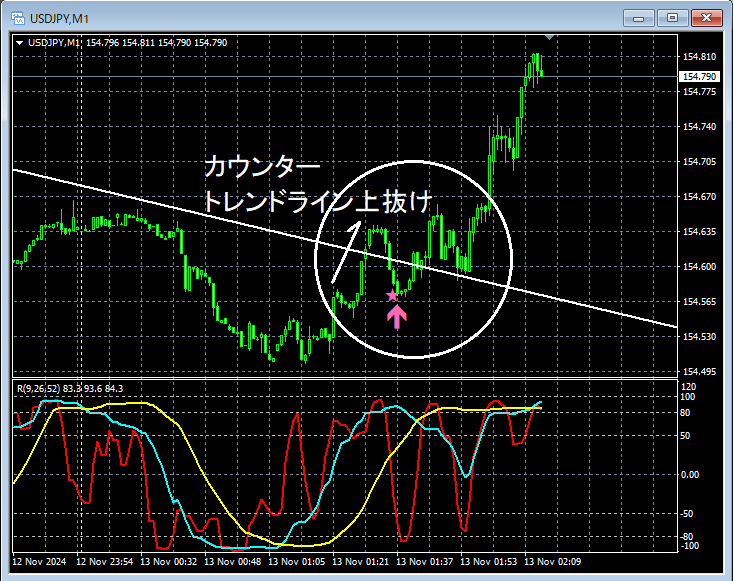
Regarding the higher timeframe, omitted. On the above 1-minute chartBreak above the counter-trend linefollowed by a pullback signalsmBDSR (two RCI lines filter) buying signallights up, and price clearly rises.
Break above the counter-trend lineandmBDSR buying signal lights upthese provide multiple entry reasons that overlap.
From this example,a trading method focused on the counter-trend lineandthe harmony with mBDSR signalsare evident.
Note: In this article, for convenience of explanation, charts may have been annotated with circles, straight lines, squares, etc.
Indicator that shines in combination with RCI: BODSOR and mBDSR
Method and Case Studies (PDF) ★GogoJungle AWARD 2020 Winner★
https://www.gogojungle.co.jp/tools/indicators/11836
The PDF file includes 358 items (over 1,400 pages, over 470,000 characters).
Many of them arecollections that logically link higher and lower timeframes using three RCI lines to examine multiple lower-timeframe conditions sequentially, ultimately waiting for pullbacks or declines on the lower timeframes (i.e., mBDSR signals)..
Additionally,many focus on identifying points where multiple entry signals converge..
Moreover,it also includes methods to explore upside and downside targets using three RCI lines..
In the explanations within the PDF files,over 1,350 chartsare used.

Method and Case Studies (PDF) ★GogoJungle AWARD 2020 Winner★
https://www.gogojungle.co.jp/tools/indicators/11836
USD/JPY 5-minute chart
USD/JPY 1-minute chart
Regarding the higher timeframe, omitted. On the above 1-minute chartBreak above the counter-trend linefollowed by a pullback signalsmBDSR (two RCI lines filter) buying signallights up, and price clearly rises.
Break above the counter-trend lineandmBDSR buying signal lights upthese provide multiple entry reasons that overlap.
From this example,a trading method focused on the counter-trend lineandthe harmony with mBDSR signalsare evident.
Note: In this article, for convenience of explanation, charts may have been annotated with circles, straight lines, squares, etc.
Indicator that shines in combination with RCI: BODSOR and mBDSR
Method and Case Studies (PDF) ★GogoJungle AWARD 2020 Winner★
https://www.gogojungle.co.jp/tools/indicators/11836
The PDF file includes 358 items (over 1,400 pages, over 470,000 characters).
Many of them arecollections that logically link higher and lower timeframes using three RCI lines to examine multiple lower-timeframe conditions sequentially, ultimately waiting for pullbacks or declines on the lower timeframes (i.e., mBDSR signals)..
Additionally,many focus on identifying points where multiple entry signals converge..
Moreover,it also includes methods to explore upside and downside targets using three RCI lines..
In the explanations within the PDF files,over 1,350 chartsare used.
× ![]()


