

RCI3 single line and value range observation theory (N calculated value) and the sign of mBDSR (3)
【Mastering RCI!!】
Indicator that shines in combination with RCI【BODSOR・mBDSR】
and methodology / case studies (PDF) ★GogoJungle AWARD2020 winner★
https://www.gogojungle.co.jp/tools/indicators/11836
NZDJPY New Zealand Dollar/Japanese Yen 5-minute chart
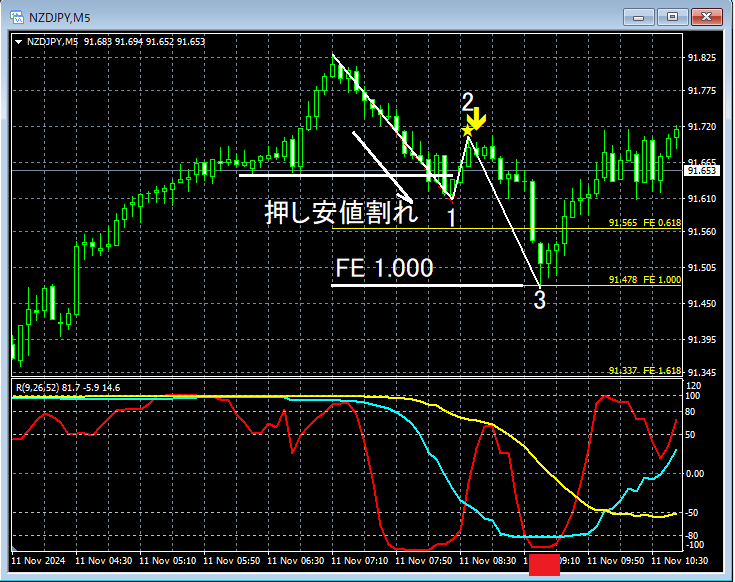
The higher timeframe context is omitted. On the 5-minute chart above,the breakout below the swing lowis followed by a rebound signal from the mBDSR (two RCI filters)short signallighting up, and price is moving downward.
As a result,RCI9 (short-term RCI)continues to fall toward the bottom area (around the red square).
In such cases,RCI9 (short-term RCI)often declines to the bottom range.
Also,the decline of RCI9 to the bottom rangecorresponds with price moving down tothe vicinity of 1.000 on the Fibonacci extension (N-value in the range observation theory).
From this example,three-line RCIandrange observation theory (N-value)andDow Theorylead to a highly compatible trading methodwith the mBDSR signals.
※ Please note that in the charts shown in this article, for convenience of explanation, circles, straight lines, and squares may be drawn in various places.
【Mastering RCI!!】
Indicator that shines in combination with RCI【BODSOR・mBDSR】
and methodology / case studies (PDF) ★GogoJungle AWARD2020 winner★
https://www.gogojungle.co.jp/tools/indicators/11836
The PDF file includes 358 items (over 1,400 pages, over 470,000 characters).
Most of them aresummaries of cases where logical linking of upper and lower timeframes is achieved using three-line RCI, sequentially examining multiple lower-timeframe conditions, and ultimately waiting for the timing of a bullish entry or bearish exit on the lower timeframes (i.e., mBDSR signals)..
Also,many focus on identifying points where multiple entry reasons converge..
Additionally,there are methods that explore upside and downside targets using three-line RCI..
In the PDF explanations,more than 1,350 chartsare used.

Indicator that shines in combination with RCI【BODSOR・mBDSR】
and methodology / case studies (PDF) ★GogoJungle AWARD2020 winner★
https://www.gogojungle.co.jp/tools/indicators/11836
NZDJPY New Zealand Dollar/Japanese Yen 5-minute chart
The higher timeframe context is omitted. On the 5-minute chart above,the breakout below the swing lowis followed by a rebound signal from the mBDSR (two RCI filters)short signallighting up, and price is moving downward.
As a result,RCI9 (short-term RCI)continues to fall toward the bottom area (around the red square).
In such cases,RCI9 (short-term RCI)often declines to the bottom range.
Also,the decline of RCI9 to the bottom rangecorresponds with price moving down tothe vicinity of 1.000 on the Fibonacci extension (N-value in the range observation theory).
From this example,three-line RCIandrange observation theory (N-value)andDow Theorylead to a highly compatible trading methodwith the mBDSR signals.
※ Please note that in the charts shown in this article, for convenience of explanation, circles, straight lines, and squares may be drawn in various places.
【Mastering RCI!!】
Indicator that shines in combination with RCI【BODSOR・mBDSR】
and methodology / case studies (PDF) ★GogoJungle AWARD2020 winner★
https://www.gogojungle.co.jp/tools/indicators/11836
The PDF file includes 358 items (over 1,400 pages, over 470,000 characters).
Most of them aresummaries of cases where logical linking of upper and lower timeframes is achieved using three-line RCI, sequentially examining multiple lower-timeframe conditions, and ultimately waiting for the timing of a bullish entry or bearish exit on the lower timeframes (i.e., mBDSR signals)..
Also,many focus on identifying points where multiple entry reasons converge..
Additionally,there are methods that explore upside and downside targets using three-line RCI..
In the PDF explanations,more than 1,350 chartsare used.
× ![]()


