

RCI3 main line and breakout above return high, break of pullback low, moving average, and mBDSR signal
【Mastering RCI!! Trend Reversal, Buy on Dips, Sell on Rallies】
Indicator 【BODSOR・mBDSR】 that shines when used with RCI
and techniques and case studies (PDF) ★GogoJungle AWARD 2020 Recipient★
https://www.gogojungle.co.jp/tools/indicators/11836
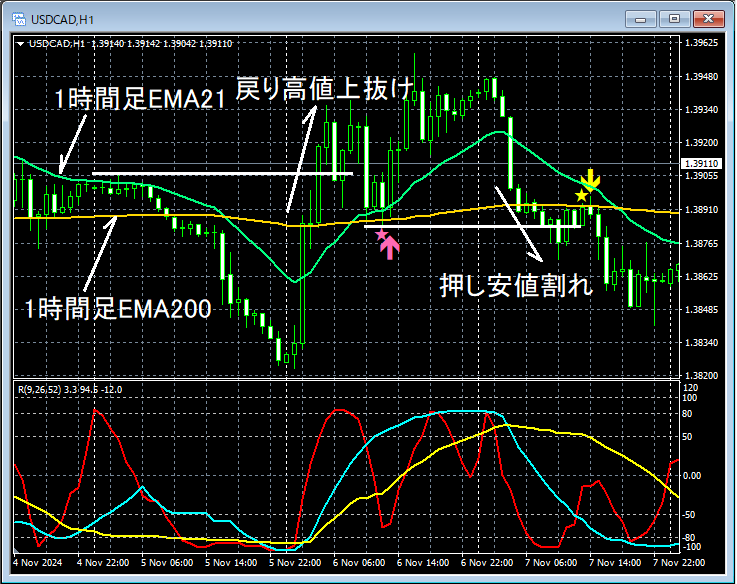
USD/CAD 1-hour chart
Details on the higher time frame are omitted. Also, the explanation of drilling down from higher to lower time frames using RCI is described in detail in the included PDF, so it is omitted here as well.
In actual trading, when formulating a plan, it is very important tounderstand the higher time frameanddrill down from higher to lower time frames using RCI.
On the 1-hour chart above (the lower time frame in this example),the higher price was broken aboveand then fell toward the vicinity ofthe 1-hour EMA21 and 1-hour EMA200andthe buy-on-dip signal of mBDSR (RCI two-filter)was lit, with the price clearly rising. Also, thereafter,the low of the pullbackwas broken below,the 1-hour EMA21 and 1-hour EMA200nearby rose againthe sell-on-rally signal of mBDSR (RCI two-filter)lit up, and subsequently the price moved lower. (As a result of drilling down from higher to lower time frames using RCI, we are looking at the 1-hour chart, not just randomly looking at one hour.)
※ Please note that the charts shown in this article may include circles, straight lines, or rectangles for clarity.
Indicator that shines when used with RCI【BODSOR・mBDSR】
and techniques and case studies (PDF) ★GogoJungle AWARD 2020 Recipient★
https://www.gogojungle.co.jp/tools/indicators/11836
The PDF file is included with 358 files (over 1,400 pages, over 470,000 characters in total).
Many of them areexamples that break down the logical linking of higher and lower time frames using three RCI lines, gradually examining multiple lower time frames and ultimately waiting for pullbacks or rallies on the lower time frame signals (i.e., mBDSR signals)..
Also,many focus on identifying points where multiple entry reasons overlap..
Additionally,there are methods that explore upside and downside targets using three RCI lines..
In the PDF explanations,more than 1,350 chartsare used.

Indicator 【BODSOR・mBDSR】 that shines when used with RCI
and techniques and case studies (PDF) ★GogoJungle AWARD 2020 Recipient★
https://www.gogojungle.co.jp/tools/indicators/11836
USD/CAD 1-hour chart
Details on the higher time frame are omitted. Also, the explanation of drilling down from higher to lower time frames using RCI is described in detail in the included PDF, so it is omitted here as well.
In actual trading, when formulating a plan, it is very important tounderstand the higher time frameanddrill down from higher to lower time frames using RCI.
On the 1-hour chart above (the lower time frame in this example),the higher price was broken aboveand then fell toward the vicinity ofthe 1-hour EMA21 and 1-hour EMA200andthe buy-on-dip signal of mBDSR (RCI two-filter)was lit, with the price clearly rising. Also, thereafter,the low of the pullbackwas broken below,the 1-hour EMA21 and 1-hour EMA200nearby rose againthe sell-on-rally signal of mBDSR (RCI two-filter)lit up, and subsequently the price moved lower. (As a result of drilling down from higher to lower time frames using RCI, we are looking at the 1-hour chart, not just randomly looking at one hour.)
※ Please note that the charts shown in this article may include circles, straight lines, or rectangles for clarity.
Indicator that shines when used with RCI【BODSOR・mBDSR】
and techniques and case studies (PDF) ★GogoJungle AWARD 2020 Recipient★
https://www.gogojungle.co.jp/tools/indicators/11836
The PDF file is included with 358 files (over 1,400 pages, over 470,000 characters in total).
Many of them areexamples that break down the logical linking of higher and lower time frames using three RCI lines, gradually examining multiple lower time frames and ultimately waiting for pullbacks or rallies on the lower time frame signals (i.e., mBDSR signals)..
Also,many focus on identifying points where multiple entry reasons overlap..
Additionally,there are methods that explore upside and downside targets using three RCI lines..
In the PDF explanations,more than 1,350 chartsare used.
× ![]()


