

From today’s chart dated 2024/11/05: the importance of top-to-bottom downscaling and the signal of mBDSR (RCI2-band filters)
【Mastering RCI!! Trend Reversal, Buy Dips, Sell Rallies】
Indicator that shines in combination with RCI: 【BODSOR・mBDSR】
Methods and Case Studies (PDF) ★GogoJungle AWARD2020 winner★
https://www.gogojungle.co.jp/tools/indicators/11836
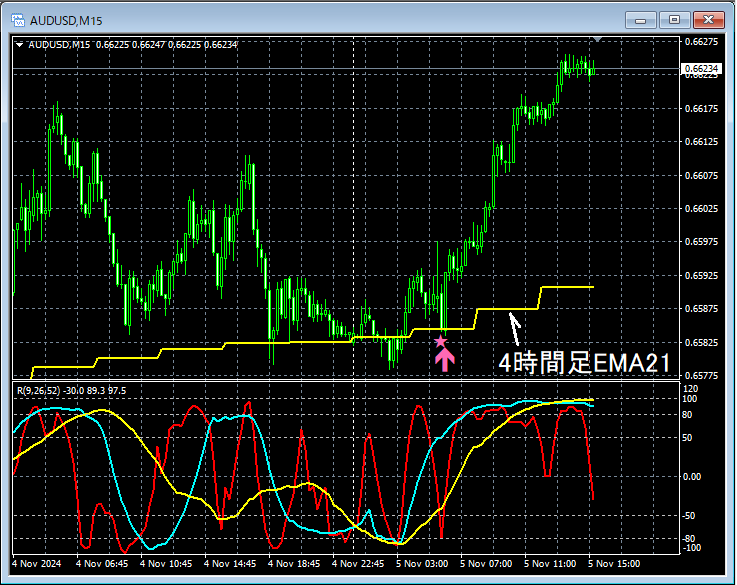
AUD/USD 15-minute chart
Regarding the higher time frame status, it is omitted. Also, the detailed explanation of how to apply RCI from higher time frames to lower time frames is provided in the accompanying PDF, so it is also omitted here.
In actual trading, when planning a strategy,Understanding higher time frame conditionsandApplying RCI to link higher time frames to lower time framesare extremely important.
On the 15-minute chart above (the lower time frame in this example),Near the 21-period EMA on the 4-hour chartafter the price declines to around it,mBDSR (RCI two-filter) buy-the-dip signallights up, and subsequently the price rises significantly (As a result of linking higher time frames to lower time frames using RCIwe are looking at the 15-minute chart, not just casually watching the 15-minute chart.)
Also, in this example, by placing the stop-loss slightly below the recent lowand achieving a favorable risk-reward tradewe can trade with good risk-reward ratios.(By understanding the higher time frame situation and applying RCI to link higher time frames to lower time frames,good risk-reward trades become possible.)
※Note: The charts shown in this article may have added circles, straight lines, or rectangles for the sake of explanation, so please be aware.
Indicator that shines in combination with RCI: 【BODSOR・mBDSR】
Methods and Case Studies (PDF) ★GogoJungle AWARD2020 winner★
https://www.gogojungle.co.jp/tools/indicators/11836
The PDF file includes 358 files (over 1,400 pages, over 470,000 characters in total).
Many of these are examples that systematically consider the status of multiple lower time frames by linking higher and lower time frames logically using the RCI three-line setup, and ultimately wait for dip-buying or pullback-selling timing (the signal of mBDSR) on the lower time frames.many pieces focus on identifying points where multiple entry reasons converge.Additionally,
.
Also included is a method for exploring upward and downward targets using the three-line RCI setup.
In the PDF explanations,more than 1,350 chartsare used.

Indicator that shines in combination with RCI: 【BODSOR・mBDSR】
Methods and Case Studies (PDF) ★GogoJungle AWARD2020 winner★
https://www.gogojungle.co.jp/tools/indicators/11836
AUD/USD 15-minute chart
Regarding the higher time frame status, it is omitted. Also, the detailed explanation of how to apply RCI from higher time frames to lower time frames is provided in the accompanying PDF, so it is also omitted here.
In actual trading, when planning a strategy,Understanding higher time frame conditionsandApplying RCI to link higher time frames to lower time framesare extremely important.
On the 15-minute chart above (the lower time frame in this example),Near the 21-period EMA on the 4-hour chartafter the price declines to around it,mBDSR (RCI two-filter) buy-the-dip signallights up, and subsequently the price rises significantly (As a result of linking higher time frames to lower time frames using RCIwe are looking at the 15-minute chart, not just casually watching the 15-minute chart.)
Also, in this example, by placing the stop-loss slightly below the recent lowand achieving a favorable risk-reward tradewe can trade with good risk-reward ratios.(By understanding the higher time frame situation and applying RCI to link higher time frames to lower time frames,good risk-reward trades become possible.)
※Note: The charts shown in this article may have added circles, straight lines, or rectangles for the sake of explanation, so please be aware.
Indicator that shines in combination with RCI: 【BODSOR・mBDSR】
Methods and Case Studies (PDF) ★GogoJungle AWARD2020 winner★
https://www.gogojungle.co.jp/tools/indicators/11836
The PDF file includes 358 files (over 1,400 pages, over 470,000 characters in total).
Many of these are examples that systematically consider the status of multiple lower time frames by linking higher and lower time frames logically using the RCI three-line setup, and ultimately wait for dip-buying or pullback-selling timing (the signal of mBDSR) on the lower time frames.many pieces focus on identifying points where multiple entry reasons converge.Additionally,
.
Also included is a method for exploring upward and downward targets using the three-line RCI setup.
In the PDF explanations,more than 1,350 chartsare used.
× ![]()


