

Today's USD/JPY (2024/11/05) Noon-rate Trade sign of mBDSR (RCI two-filter)
0
【Mastering RCI!! Trend Reversals, Buy Dips, and Sell Rallies】
Indicator【BODSOR・mBDSR】powered by combination with RCI
Methods and Case Studies (PDF) ★GogoJungle AWARD2020 winner★
https://www.gogojungle.co.jp/tools/indicators/11836
USDJPY 5-minute chart
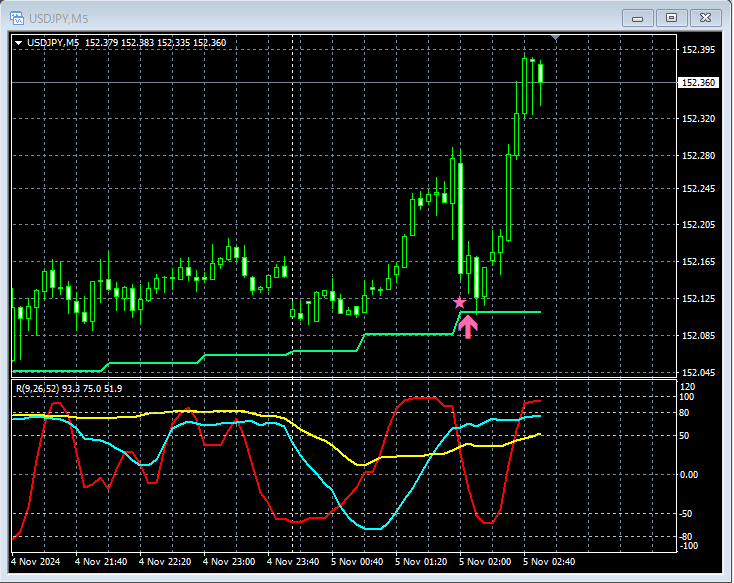
Looking at the 5-minute chart above,mBDSR (RCI two-line filter) buy-the-dip signallights up,1-hour EMA21acts as support and pricerises toward the opening price (settlement)and moves upward steadily.
From this example,a trading method focusing on the settlement price and moving averagesandthe signals of mBDSRshow strong compatibility.
※Please note that in the charts introduced in this article, for convenience of explanation, there may be additions of circles, lines, or squares.
Indicator【BODSOR・mBDSR】powerfully complemented by RCI
Methods and Case Studies (PDF) ★GogoJungle AWARD2020 winner★
https://www.gogojungle.co.jp/tools/indicators/11836
The PDF file includes 358 files (over 1,400 pages, over 470,000 words).
Most of them document cases wherelinking higher-timeframe and lower-timeframe logically using three RCI lines, examining multiple lower-timeframe conditions sequentially, and ultimately waiting for dips or pullbacks on the lower timeframe (i.e., mBDSR signals)as a summarized approach.
Additionally,many focus on identifying points where multiple entry reasons overlap..
Moreover,there are methods that explore upward and downward targets using three RCI lines.Also included.
In the explanations within the PDF files,more than 1,350 chartsare used.

Indicator【BODSOR・mBDSR】powered by combination with RCI
Methods and Case Studies (PDF) ★GogoJungle AWARD2020 winner★
https://www.gogojungle.co.jp/tools/indicators/11836
USDJPY 5-minute chart
Looking at the 5-minute chart above,mBDSR (RCI two-line filter) buy-the-dip signallights up,1-hour EMA21acts as support and pricerises toward the opening price (settlement)and moves upward steadily.
From this example,a trading method focusing on the settlement price and moving averagesandthe signals of mBDSRshow strong compatibility.
※Please note that in the charts introduced in this article, for convenience of explanation, there may be additions of circles, lines, or squares.
Indicator【BODSOR・mBDSR】powerfully complemented by RCI
Methods and Case Studies (PDF) ★GogoJungle AWARD2020 winner★
https://www.gogojungle.co.jp/tools/indicators/11836
The PDF file includes 358 files (over 1,400 pages, over 470,000 words).
Most of them document cases wherelinking higher-timeframe and lower-timeframe logically using three RCI lines, examining multiple lower-timeframe conditions sequentially, and ultimately waiting for dips or pullbacks on the lower timeframe (i.e., mBDSR signals)as a summarized approach.
Additionally,many focus on identifying points where multiple entry reasons overlap..
Moreover,there are methods that explore upward and downward targets using three RCI lines.Also included.
In the explanations within the PDF files,more than 1,350 chartsare used.
× ![]()


