

RCI3 Single Line and Width Observation Theory (N Calculated Value) and mBDSR Sign (2)
Indicator that shines in combination with RCI【BODSOR・mBDSR】
Methods, cases study (PDF) ★GogoJungle AWARD2020 winner★
https://www.gogojungle.co.jp/tools/indicators/11836
AUDJPY 15-minute chart
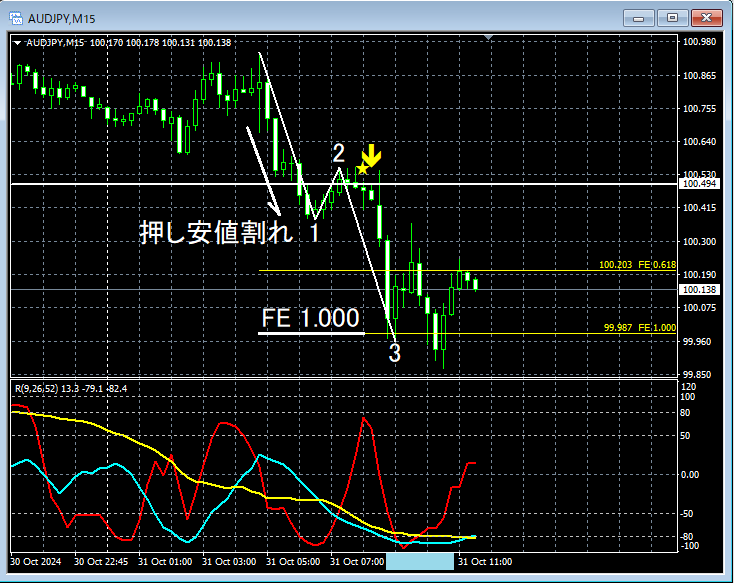
Top-level chart is omitted. On the above 15-minute chart,a breakdown of the “swing low”below which the price risesmBDSR (RCI two-filter) selling signallights up, and the price moves lower.
As a result,RCI26 (mid-term RCI)continues to decline toward the bottom area (around the light-blue square).
In the above example,RCI three-linecan be used to logically link the higher and lower timeframes,to look for the descent target of RCI, but detailed explanations of the technique are delegated to the attached PDF.
Also,the price declines toward the bottom of the mid-term RCI (RCI26)andapproaches the area around the 1.000 Fibonacci expansion (N-value in the range projection theory).
From this example,the three-line RCIandrange projection theory (N values)andDow Theoryshow a strong compatibility with trading methods that focus on signals from mBDSR.
※ Please note that in charts mentioned in this article, for convenience, circles, straight lines, and rectangles may be added.
Indicator that shines in combination with RCI【BODSOR・mBDSR】
Methods, cases study (PDF) ★GogoJungle AWARD2020 winner★
https://www.gogojungle.co.jp/tools/indicators/11836
The PDF file includes 341 items (over 1,200 pages in total, over 430,000 words total).
Many of these are items that summarize examples where the higher and lower timeframes are logically linked using the three-line RCI, sequentially examining multiple lower timeframes, and ultimately waiting for the timing to buy on dips or sell on rallies on the lower timeframes (i.e., the mBDSR signals).many entries focus on overlapping entry justification.Additionally,
.
Note thatthere are also methods that explore ascent or descent targets using the three-line RCI..
In the PDF explanations,are used.

Methods, cases study (PDF) ★GogoJungle AWARD2020 winner★
https://www.gogojungle.co.jp/tools/indicators/11836
AUDJPY 15-minute chart
Top-level chart is omitted. On the above 15-minute chart,a breakdown of the “swing low”below which the price risesmBDSR (RCI two-filter) selling signallights up, and the price moves lower.
As a result,RCI26 (mid-term RCI)continues to decline toward the bottom area (around the light-blue square).
In the above example,RCI three-linecan be used to logically link the higher and lower timeframes,to look for the descent target of RCI, but detailed explanations of the technique are delegated to the attached PDF.
Also,the price declines toward the bottom of the mid-term RCI (RCI26)andapproaches the area around the 1.000 Fibonacci expansion (N-value in the range projection theory).
From this example,the three-line RCIandrange projection theory (N values)andDow Theoryshow a strong compatibility with trading methods that focus on signals from mBDSR.
※ Please note that in charts mentioned in this article, for convenience, circles, straight lines, and rectangles may be added.
Indicator that shines in combination with RCI【BODSOR・mBDSR】
Methods, cases study (PDF) ★GogoJungle AWARD2020 winner★
https://www.gogojungle.co.jp/tools/indicators/11836
The PDF file includes 341 items (over 1,200 pages in total, over 430,000 words total).
Many of these are items that summarize examples where the higher and lower timeframes are logically linked using the three-line RCI, sequentially examining multiple lower timeframes, and ultimately waiting for the timing to buy on dips or sell on rallies on the lower timeframes (i.e., the mBDSR signals).many entries focus on overlapping entry justification.Additionally,
.
Note thatthere are also methods that explore ascent or descent targets using the three-line RCI..
In the PDF explanations,are used.
× ![]()


