

RCI3 Single Line and Range Observation Theory (N Calculated Value) and the Sign of mBDSR (1)
0
Indicator that shines in combination with RCI: BODSOR and mBDSR
Methods and Case Studies (PDF) ★GogoJungle AWARD 2020 Recipient★
https://www.gogojungle.co.jp/tools/indicators/11836
Euro/Oz NZD? EURAUD 5-minute chart
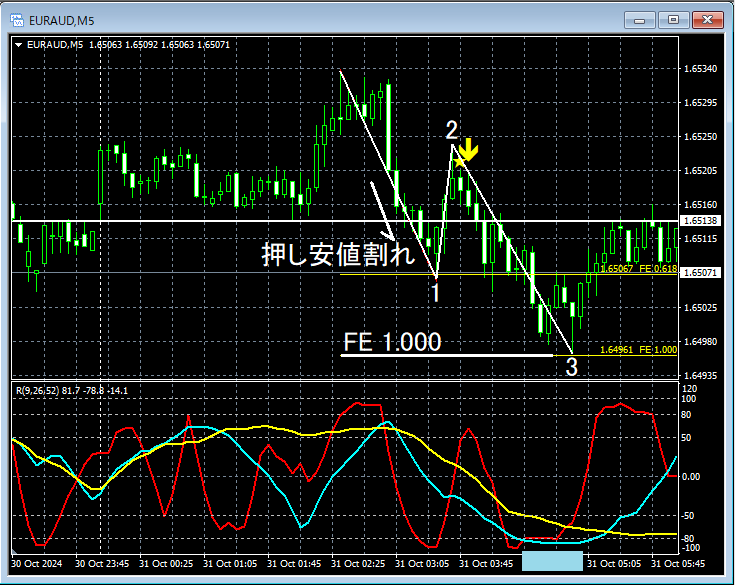
Upper time-frame context is omitted. On the 5-minute chart above,a break below the rising swing lowis followed by a rallymBDSR (RCI two-filter) reversal signallights up, and price declines.
As a result,RCI26 (mid-term RCI)falls toward the bottom range (around the light blue box).
In the above example,by using the three-line RCIto logically link the higher and lower time frames,one can explore the target for RCI's decline, though the detailed explanation of that method is left to the accompanying PDF.
Also,the price moves down to around the level of the bottom of the RCI26 (mid-term RCI)and reachesnear the 1.000 level of Fibonacci extension (N-value in amplitude analysis).
From this example,the three-line RCIandamplitude analysis (N-value)andDow Theoryare highly compatible with a trading methodand the signals of mBDSR.
Note: The charts shown in this article may include added circles, straight lines, or boxes for explanatory convenience.
Indicator that shines in combination with RCI: BODSOR and mBDSR
Methods and Case Studies (PDF) ★GogoJungle AWARD2020 Recipient★
https://www.gogojungle.co.jp/tools/indicators/11836
The PDF file includes 341 items (over 1,200 pages, over 430,000 characters in total).
Many of them aresummaries of cases where multiple lower-time-frame conditions are examined sequentially by logically linking higher and lower time frames using the three-line RCI, eventually waiting for the timing of a swing buy or pullback sell on the lower time frame (i.e., the mBDSR signal)..
Also,many focus on capturing points where multiple entry reasons overlap..
Additionally,there are methods that explore upside and downside targets using the three-line RCI..
In the explanations within the PDF files,they utilize more than 1,200 charts..

Methods and Case Studies (PDF) ★GogoJungle AWARD 2020 Recipient★
https://www.gogojungle.co.jp/tools/indicators/11836
Euro/Oz NZD? EURAUD 5-minute chart
Upper time-frame context is omitted. On the 5-minute chart above,a break below the rising swing lowis followed by a rallymBDSR (RCI two-filter) reversal signallights up, and price declines.
As a result,RCI26 (mid-term RCI)falls toward the bottom range (around the light blue box).
In the above example,by using the three-line RCIto logically link the higher and lower time frames,one can explore the target for RCI's decline, though the detailed explanation of that method is left to the accompanying PDF.
Also,the price moves down to around the level of the bottom of the RCI26 (mid-term RCI)and reachesnear the 1.000 level of Fibonacci extension (N-value in amplitude analysis).
From this example,the three-line RCIandamplitude analysis (N-value)andDow Theoryare highly compatible with a trading methodand the signals of mBDSR.
Note: The charts shown in this article may include added circles, straight lines, or boxes for explanatory convenience.
Indicator that shines in combination with RCI: BODSOR and mBDSR
Methods and Case Studies (PDF) ★GogoJungle AWARD2020 Recipient★
https://www.gogojungle.co.jp/tools/indicators/11836
The PDF file includes 341 items (over 1,200 pages, over 430,000 characters in total).
Many of them aresummaries of cases where multiple lower-time-frame conditions are examined sequentially by logically linking higher and lower time frames using the three-line RCI, eventually waiting for the timing of a swing buy or pullback sell on the lower time frame (i.e., the mBDSR signal)..
Also,many focus on capturing points where multiple entry reasons overlap..
Additionally,there are methods that explore upside and downside targets using the three-line RCI..
In the explanations within the PDF files,they utilize more than 1,200 charts..
× ![]()


