

Aiming to master RCI!! From yesterday’s (October 30, 2024) USD/JPY chart
0
Indicator that captures “Top/Bottom, Reversals” in combination with RCI: 【mBDSR】
Methods and Case Studies (PDF) ★GogoJungle AWARD2020 Winner★
https://www.gogojungle.co.jp/tools/indicators/11836
R1R2S2 is included in the above product. For details, please see the article below on Investment Navi+.
RCI three-line “Two-stage Confirmation” to target trend reversals, buying on dips, and selling on rallies – the indicator “R1R2S2” released!!
USDJPY - 15-minute chart
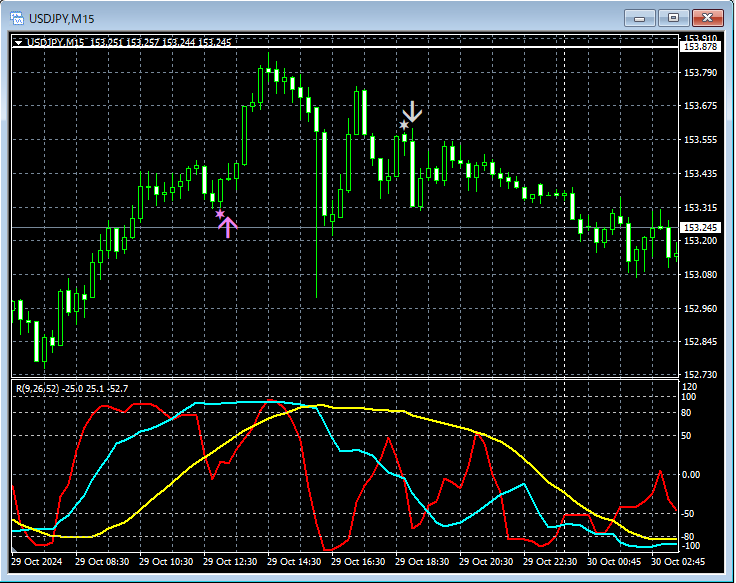
The higher-timeframe chart is omitted. On the 15-minute chart above,R1R2S2 dip-buy signalis lit upnear the previous high on the higher timeframeafter rising and then retreating. During the retreat,R1R2S2 sell-on-rally signalis lit up.
USDJPY - 1-minute chart
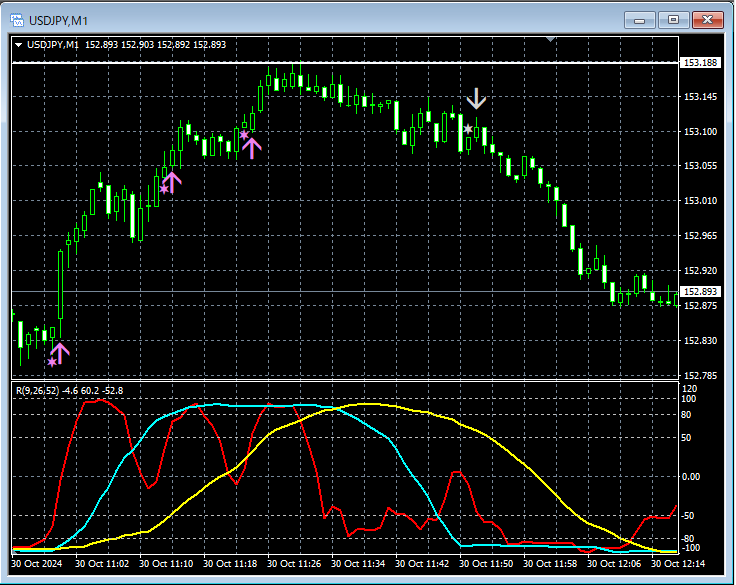
The higher-timeframe chart is omitted. On the 1-minute chart above,R1R2S2 dip-buy signallights up three timesrising up to a line that previously acted as supportand then retreating (the so-calledsupport-resistance turn). During the retreat,R1R2S2 sell-on-rally signallights up.
※Please note that in the charts introduced in this article, for convenience, circles, lines, and rectangles may have been drawn.
Indicator that shows power in combination with RCI: 【BODSOR・mBDSR】
Methods and Case Studies (PDF) ★GogoJungle AWARD2020 Winner★
https://www.gogojungle.co.jp/tools/indicators/11836
The PDF file contains 341 items (over 1,200 pages, over 430,000 characters).
Many of them are centered on logically linking higher and lower timeframes using the RCI three-line setup, then examining multiple lower-timeframe situations sequentially, ultimately waiting for dip-buy or rally-sell timing (i.e., the mBDSR signal) on the lower timeframe.
Additionally,many pieces focus on identifying points where multiple entry signals coincide.There are also many that include methods to explore upside and downside targets using the RCI three-line setup.
In the description within the PDF,
are used.

Methods and Case Studies (PDF) ★GogoJungle AWARD2020 Winner★
https://www.gogojungle.co.jp/tools/indicators/11836
R1R2S2 is included in the above product. For details, please see the article below on Investment Navi+.
RCI three-line “Two-stage Confirmation” to target trend reversals, buying on dips, and selling on rallies – the indicator “R1R2S2” released!!
USDJPY - 15-minute chart
The higher-timeframe chart is omitted. On the 15-minute chart above,R1R2S2 dip-buy signalis lit upnear the previous high on the higher timeframeafter rising and then retreating. During the retreat,R1R2S2 sell-on-rally signalis lit up.
USDJPY - 1-minute chart
The higher-timeframe chart is omitted. On the 1-minute chart above,R1R2S2 dip-buy signallights up three timesrising up to a line that previously acted as supportand then retreating (the so-calledsupport-resistance turn). During the retreat,R1R2S2 sell-on-rally signallights up.
※Please note that in the charts introduced in this article, for convenience, circles, lines, and rectangles may have been drawn.
Indicator that shows power in combination with RCI: 【BODSOR・mBDSR】
Methods and Case Studies (PDF) ★GogoJungle AWARD2020 Winner★
https://www.gogojungle.co.jp/tools/indicators/11836
The PDF file contains 341 items (over 1,200 pages, over 430,000 characters).
Many of them are centered on logically linking higher and lower timeframes using the RCI three-line setup, then examining multiple lower-timeframe situations sequentially, ultimately waiting for dip-buy or rally-sell timing (i.e., the mBDSR signal) on the lower timeframe.
Additionally,many pieces focus on identifying points where multiple entry signals coincide.There are also many that include methods to explore upside and downside targets using the RCI three-line setup.
In the description within the PDF,
are used.
× ![]()


