

Mastering RCI!! From yesterday's (2024/10/26) USD/JPY chart
【Mastering RCI!! Trend Reversal, Buy on Pullbacks, Sell on Rallies】
Indicator 【BODSOR・mBDSR】 that shines in combination with RCI
and methods・case studies (PDF) ★GogoJungle AWARD2020 Winner★
https://www.gogojungle.co.jp/tools/indicators/11836
USDJPY, 30-minute chart

The status of the higher timeframes is omitted. Also, here we are viewing the 30-minute chart by dropping from the higher timeframe using RCI, but the process of that drop is omitted. It is not that we are randomly choosing a 30-minute chart to trade.
Looking at the upper 30-minute chart,Counter-trend lineis a point of focus. As a resultWave 1breaks above theCounter-trend line,Wave 2pulls back to thebackside of the counter-trend lineand thenWave 3rises firmly. Next, we will look at the area circled with a white circle.
USDJPY, 30-minute chart
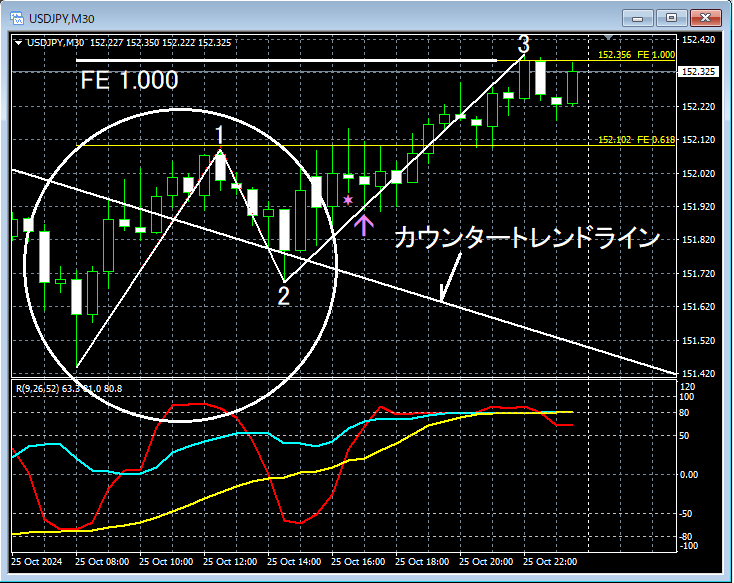
Looking at the upper 30-minute chart,Wave 3in progress there isan R1R2S2 pullback buy signallighting up, and subsequentlyFibonacci expansionrises firmly to around 1.000. Next, we will look at the area circled with a white circle on the 5-minute chart. While using RCI allows us to firmly drop from the 30-minute to the 5-minute chart with justification for waiting for signals, that process is omitted here. It is not that we randomly chose a 5-minute chart to view.
USDJPY, 5-minute chart
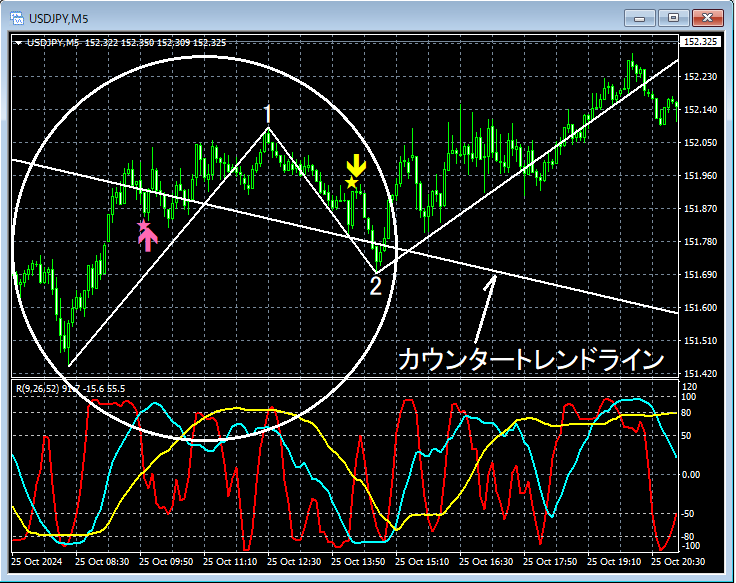
Looking at the above 5-minute chart,Wave 1in progressmBDSR pullback buy signalis lit,Wave 2in progressmBDSR pullback sell signalis lit at a timely moment. Next, we will look at the same 5-minute chart from another perspective at the area circled with a white circle above.
USDJPY, 5-minute chart
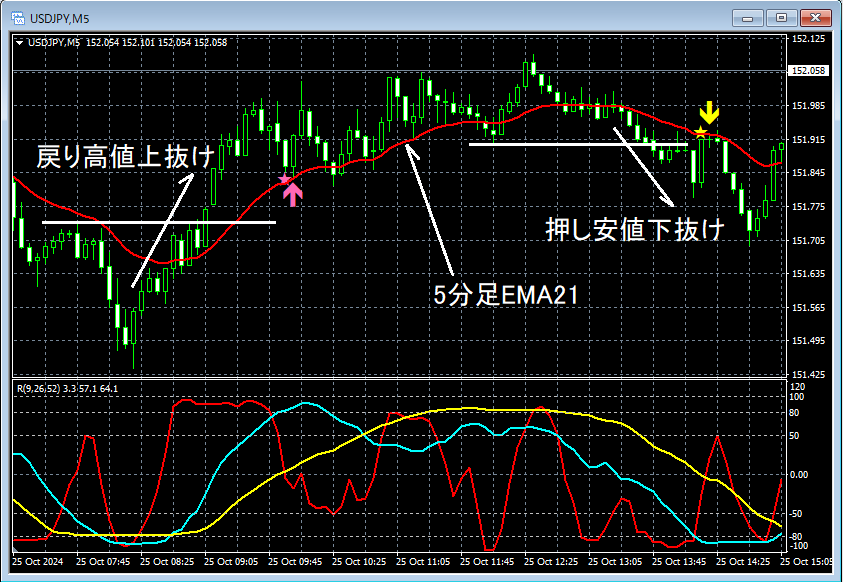
Looking at the above 5-minute chart,break above the previous high on a pullbackThen, near the important moving averageEMA21pulls back to around,mBDSR (RCI two-filter) pullback buy signalis lit,break below the pullback lowand,EMA21rises back up to around,mBDSR (RCI two-filter) pullback sell signallights up at the right time.
In the above example, the 30-minute chart'sR1R2S2 signalsand the 5-minute chart'smBDSR signalsoccur where multiple entry reasons overlap.
Yesterday, in addition to the above, there was an interesting situation of a decline from near the counter-trend line, but that is omitted.
※In this article,the portion that drops from the higher timeframe to the lower timeframe using RCI and waits for R1R2S2 signals on the 30-minute chart, and the further portion that drops using RCI from the higher timeframe to the 5-minute chart to wait for mBDSR (RCI two-filter) signalsare omitted, butusing RCI allows you to connect the higher and lower timeframes like solving a puzzle, which I find very appealing. The details of this method are explained in the accompanying PDF.
※ Specifically, using the above example's chart,and the process to drop from the 4-hour and 1-hour charts, which are not discussed above, to the 30-minute chart to wait for R1R2S2 signalsandthe process to wait for mBDSR signals from the 30-minute to 15-minute and then to 5-minute chartswill be added in a future 343rd attached PDF.Already added (October 27, 2024 update).
※Please note that the charts shown in this article may have added circles, lines, or boxes for explanatory convenience.
Indicator 【BODSOR・mBDSR】 that shines in combination with RCI
and methods・case studies (PDF) ★GogoJungle AWARD2020 Winner★
https://www.gogojungle.co.jp/tools/indicators/11836
The PDF file consists of 341 items (over 1,200 pages, over 430,000 words in total).
Most of them areexamples of logically linking higher and lower timeframes using the three RCI lines, sequentially examining multiple lower timeframes, and ultimately waiting for pullbacks or pullback sell timings (i.e., mBDSR signals) on the lower timeframes.
Also,many of them focus on identifying overlapping entry reasons..
Furthermore,there are methods that explore upside targets and downside targets using the three RCI lines..
In the PDF explanations,over 1,200 chartsare used.

Indicator 【BODSOR・mBDSR】 that shines in combination with RCI
and methods・case studies (PDF) ★GogoJungle AWARD2020 Winner★
https://www.gogojungle.co.jp/tools/indicators/11836
USDJPY, 30-minute chart
The status of the higher timeframes is omitted. Also, here we are viewing the 30-minute chart by dropping from the higher timeframe using RCI, but the process of that drop is omitted. It is not that we are randomly choosing a 30-minute chart to trade.
Looking at the upper 30-minute chart,Counter-trend lineis a point of focus. As a resultWave 1breaks above theCounter-trend line,Wave 2pulls back to thebackside of the counter-trend lineand thenWave 3rises firmly. Next, we will look at the area circled with a white circle.
USDJPY, 30-minute chart
Looking at the upper 30-minute chart,Wave 3in progress there isan R1R2S2 pullback buy signallighting up, and subsequentlyFibonacci expansionrises firmly to around 1.000. Next, we will look at the area circled with a white circle on the 5-minute chart. While using RCI allows us to firmly drop from the 30-minute to the 5-minute chart with justification for waiting for signals, that process is omitted here. It is not that we randomly chose a 5-minute chart to view.
USDJPY, 5-minute chart
Looking at the above 5-minute chart,Wave 1in progressmBDSR pullback buy signalis lit,Wave 2in progressmBDSR pullback sell signalis lit at a timely moment. Next, we will look at the same 5-minute chart from another perspective at the area circled with a white circle above.
USDJPY, 5-minute chart
Looking at the above 5-minute chart,break above the previous high on a pullbackThen, near the important moving averageEMA21pulls back to around,mBDSR (RCI two-filter) pullback buy signalis lit,break below the pullback lowand,EMA21rises back up to around,mBDSR (RCI two-filter) pullback sell signallights up at the right time.
In the above example, the 30-minute chart'sR1R2S2 signalsand the 5-minute chart'smBDSR signalsoccur where multiple entry reasons overlap.
Yesterday, in addition to the above, there was an interesting situation of a decline from near the counter-trend line, but that is omitted.
※In this article,the portion that drops from the higher timeframe to the lower timeframe using RCI and waits for R1R2S2 signals on the 30-minute chart, and the further portion that drops using RCI from the higher timeframe to the 5-minute chart to wait for mBDSR (RCI two-filter) signalsare omitted, butusing RCI allows you to connect the higher and lower timeframes like solving a puzzle, which I find very appealing. The details of this method are explained in the accompanying PDF.
※ Specifically, using the above example's chart,and the process to drop from the 4-hour and 1-hour charts, which are not discussed above, to the 30-minute chart to wait for R1R2S2 signalsandthe process to wait for mBDSR signals from the 30-minute to 15-minute and then to 5-minute chartswill be added in a future 343rd attached PDF.Already added (October 27, 2024 update).
※Please note that the charts shown in this article may have added circles, lines, or boxes for explanatory convenience.
Indicator 【BODSOR・mBDSR】 that shines in combination with RCI
and methods・case studies (PDF) ★GogoJungle AWARD2020 Winner★
https://www.gogojungle.co.jp/tools/indicators/11836
The PDF file consists of 341 items (over 1,200 pages, over 430,000 words in total).
Most of them areexamples of logically linking higher and lower timeframes using the three RCI lines, sequentially examining multiple lower timeframes, and ultimately waiting for pullbacks or pullback sell timings (i.e., mBDSR signals) on the lower timeframes.
Also,many of them focus on identifying overlapping entry reasons..
Furthermore,there are methods that explore upside targets and downside targets using the three RCI lines..
In the PDF explanations,over 1,200 chartsare used.
× ![]()


