

[Master RCI!!] Selling strategy from the recent dollar/yen high zone and the mBDSR signal
【Mastering RCI!! Trend Reversal, Buy on Dips, Sell on Rallies】
Indicator 【BODSOR・mBDSR】 that delivers power in combination with RCI
and Method/Case Studies (PDF) ★GogoJungle AWARD2020 recipient★
https://www.gogojungle.co.jp/tools/indicators/11836
USDJPY, 5-minute chart
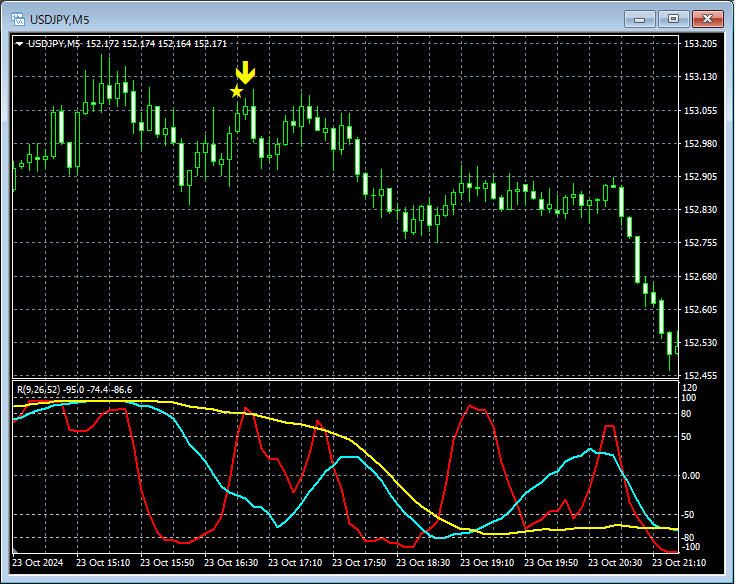
The status of the higher timeframe is omitted. Looking at the 5-minute above,mBDSR (RCI two-filter) overbought signallights up, and subsequently the price has clearly moved lower.
In this article,the part that uses RCI to link from higher to lower timeframes and leads to waiting for the mBDSR (RCI two-filter) overbought signal on the 5-minute chartis omitted, butusing RCI allows you to think like solving a puzzle from higher to lower timeframesand this is something I greatly appreciate.
※In the above example, it is also possible to drill down to the 1-minute chart to seek signals at an earlier timing, or patiently wait for signals on the 30-minute chart. It is also possible to examine downside targets using the three-line RCI. This method is explained in detail in the accompanying PDF.
※ Specifically, using the chart in the above example totrace the process from looking for an upside target on the daily chart to bringing it down to the 30-minute, 5-minute, and 1-minute charts to wait for the mBDSR (RCI two-filter) overbought signalandexploring downside targets with the three-line RCIis something I plan to add as the 339th accompanying PDF in the future.Already added (October 25, 2024 update).
※Please note that for convenience, some charts in this article may include added circles, straight lines, or rectangles.
Indicator 【BODSOR・mBDSR】 that delivers power in combination with RCI
and Method/Case Studies (PDF) ★GogoJungle AWARD2020 recipient★
https://www.gogojungle.co.jp/tools/indicators/11836
The PDF files include 337 items (over 1,200 pages, over 430,000 characters).
Many of themare summaries of cases where the three-line RCI links higher and lower timeframes logically, exploring the states of multiple lower timeframes in order, and ultimately waiting for a dip buy or a pullback timing (i.e., the signals of mBDSR) on the lower timeframes..
Additionally,many emphasize identifying points where multiple entry signals converge.There are many cases like this.
Note,the method of exploring upside and downside targets using the three-line RCIis also included.
In the PDF explanations,over 1,200 chartsare used.

Indicator 【BODSOR・mBDSR】 that delivers power in combination with RCI
and Method/Case Studies (PDF) ★GogoJungle AWARD2020 recipient★
https://www.gogojungle.co.jp/tools/indicators/11836
USDJPY, 5-minute chart
The status of the higher timeframe is omitted. Looking at the 5-minute above,mBDSR (RCI two-filter) overbought signallights up, and subsequently the price has clearly moved lower.
In this article,the part that uses RCI to link from higher to lower timeframes and leads to waiting for the mBDSR (RCI two-filter) overbought signal on the 5-minute chartis omitted, butusing RCI allows you to think like solving a puzzle from higher to lower timeframesand this is something I greatly appreciate.
※In the above example, it is also possible to drill down to the 1-minute chart to seek signals at an earlier timing, or patiently wait for signals on the 30-minute chart. It is also possible to examine downside targets using the three-line RCI. This method is explained in detail in the accompanying PDF.
※ Specifically, using the chart in the above example totrace the process from looking for an upside target on the daily chart to bringing it down to the 30-minute, 5-minute, and 1-minute charts to wait for the mBDSR (RCI two-filter) overbought signalandexploring downside targets with the three-line RCIis something I plan to add as the 339th accompanying PDF in the future.Already added (October 25, 2024 update).
※Please note that for convenience, some charts in this article may include added circles, straight lines, or rectangles.
Indicator 【BODSOR・mBDSR】 that delivers power in combination with RCI
and Method/Case Studies (PDF) ★GogoJungle AWARD2020 recipient★
https://www.gogojungle.co.jp/tools/indicators/11836
The PDF files include 337 items (over 1,200 pages, over 430,000 characters).
Many of themare summaries of cases where the three-line RCI links higher and lower timeframes logically, exploring the states of multiple lower timeframes in order, and ultimately waiting for a dip buy or a pullback timing (i.e., the signals of mBDSR) on the lower timeframes..
Additionally,many emphasize identifying points where multiple entry signals converge.There are many cases like this.
Note,the method of exploring upside and downside targets using the three-line RCIis also included.
In the PDF explanations,over 1,200 chartsare used.
× ![]()


