

Master RCI!! Targeting a rebound sell from the break of the support price and the mBDSR signal
【Mastering RCI!! Trend Reversal, Buy the Dip, Sell on the Rally】
Indicator that shines in combination with RCI【BODSOR・mBDSR】
and methods, case studies (PDF) ★GogoJungle AWARD2020 Winner★
https://www.gogojungle.co.jp/tools/indicators/11836
GOLD XAUUSD 15-minute chart
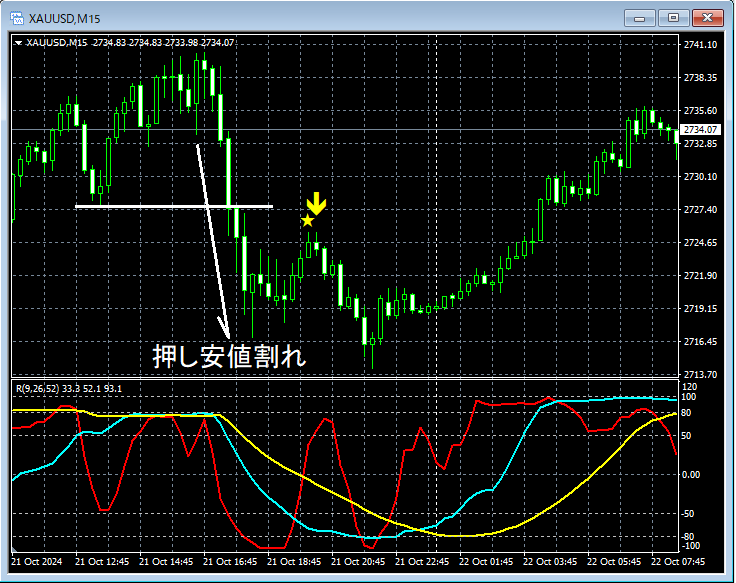
Regarding the higher timeframe, it will be omitted. Looking at the 15-minute chart above,a break of the minor swing lowfollowing the risemBDSR (two RCI filters) overbought signalis lighting up. And afterward, price has clearly moved lower.
Break of the minor swing lowandmBDSR (two RCI filters) overbought signal lighting upoverlap as multiple entry reasons.
From this example,a trading method focused on Dow Theoryandthe signals of mBDSRshow strong compatibility.
※This article omits the part that brings down from higher to lower timeframes using RCI to wait for the mBDSR signal on the 15-minute timeframe, butusing RCI makes it often possible to connect from higher to lower timeframes like solving a puzzlewhich I highly appreciate.
In the above example, you can also drill down to the 1-minute chart to trade with favorable risk-reward. Detailed coverage is provided in the attached PDF below.
336th attached PDF file【mBDSRhint1336_20241023.pdf】
Thinking about better risk-reward trades (Part 2)
※Please note that in the charts shown in this article, for convenience of explanation, circles, lines, and squares may be drawn.
Indicator that shines in combination with RCI【BODSOR・mBDSR】
and methods, case studies (PDF) ★GogoJungle AWARD2020 Winner★
https://www.gogojungle.co.jp/tools/indicators/11836
There are 337 PDF files attached (over 1,200 pages in total, over 430,000 words).
Most of them are summaries of examples that decompose the situations of multiple lower timeframes by logically linking the upper and lower timeframes using three RCI lines, ultimately waiting for the lower timeframe’s pullback buying or rally selling timing (i.e., the mBDSR signal).
Also,many of them focus on capturing points where multiple entry signals align..
Additionally,there are methods for exploring upside targets and downside targets using three RCI lines..
In the PDF explanations,over 1,200 chartsare used.

Indicator that shines in combination with RCI【BODSOR・mBDSR】
and methods, case studies (PDF) ★GogoJungle AWARD2020 Winner★
https://www.gogojungle.co.jp/tools/indicators/11836
GOLD XAUUSD 15-minute chart
Regarding the higher timeframe, it will be omitted. Looking at the 15-minute chart above,a break of the minor swing lowfollowing the risemBDSR (two RCI filters) overbought signalis lighting up. And afterward, price has clearly moved lower.
Break of the minor swing lowandmBDSR (two RCI filters) overbought signal lighting upoverlap as multiple entry reasons.
From this example,a trading method focused on Dow Theoryandthe signals of mBDSRshow strong compatibility.
※This article omits the part that brings down from higher to lower timeframes using RCI to wait for the mBDSR signal on the 15-minute timeframe, butusing RCI makes it often possible to connect from higher to lower timeframes like solving a puzzlewhich I highly appreciate.
In the above example, you can also drill down to the 1-minute chart to trade with favorable risk-reward. Detailed coverage is provided in the attached PDF below.
336th attached PDF file【mBDSRhint1336_20241023.pdf】
Thinking about better risk-reward trades (Part 2)
※Please note that in the charts shown in this article, for convenience of explanation, circles, lines, and squares may be drawn.
Indicator that shines in combination with RCI【BODSOR・mBDSR】
and methods, case studies (PDF) ★GogoJungle AWARD2020 Winner★
https://www.gogojungle.co.jp/tools/indicators/11836
There are 337 PDF files attached (over 1,200 pages in total, over 430,000 words).
Most of them are summaries of examples that decompose the situations of multiple lower timeframes by logically linking the upper and lower timeframes using three RCI lines, ultimately waiting for the lower timeframe’s pullback buying or rally selling timing (i.e., the mBDSR signal).
Also,many of them focus on capturing points where multiple entry signals align..
Additionally,there are methods for exploring upside targets and downside targets using three RCI lines..
In the PDF explanations,over 1,200 chartsare used.
× ![]()


