

Using the three-line RCI to gauge profit targets (16)
0
Indicator that shines in combination with RCI: BODSOR・mBDSR
and methods / case studies (PDF) ★GogoJungle AWARD2020 winner★
https://www.gogojungle.co.jp/tools/indicators/11836
USD/JPY 5-minute chart
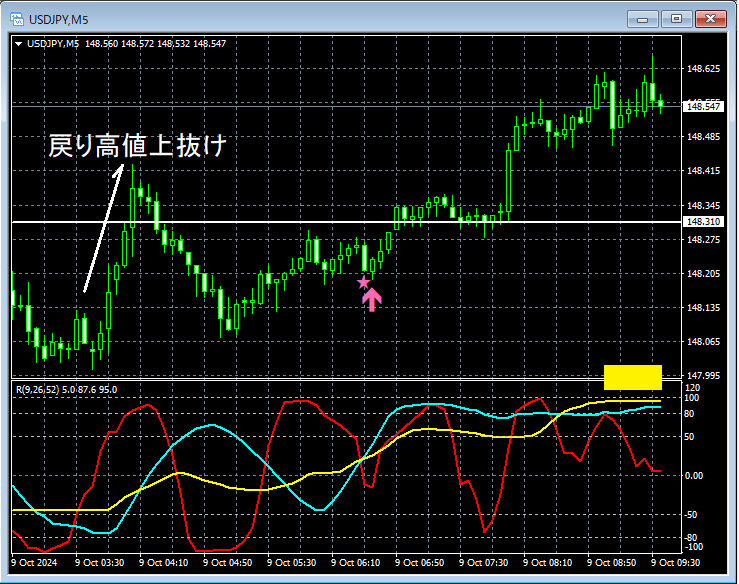
The higher time-frame context is omitted. On the upper 5-minute chart, after breaking above the retrace high, prices have declined. Subsequently, as prices rose again and during the ascentmBDSR (2-line RCI) pullback buy signallights up, and the price shows a solid upward move.
As a resultRCI52 (long-term RCI)has risen to cling near the top of the range (around the yellow square).
In the above example,Using the 3-RCI-lineto logically link higher and lower time-frames allows you toexplore the upward target of the RCI, but a detailed explanation of this technique is left to the attached PDF below.
Attachment PDF file #322【mBDSRhint1322_20241009.pdf】
“[Important] Thinking about the upward target using 3-RCI-lines (8)”
※ Please note that for convenience in this article, charts may include added circles, lines, and boxes for explanatory purposes.
Indicator that shines in combination with RCI: BODSOR・mBDSR
and methods / case studies (PDF) ★GogoJungle AWARD2020 winner★
https://www.gogojungle.co.jp/tools/indicators/11836
The PDF file includes 341 attachments (over 1,200 pages, over 430,000 words in total).
Many of these are examples that, by using the 3-RCI-lines to logically link higher and lower time-frames, analyze the multiple lower-time-frame conditions sequentially, ultimately outlining a setup on the lower time-frame to wait for a pullback buy or retracement sell signal from mBDSR.there are many that emphasize pinpointing points where multiple entry reasons converge.In addition,
.
Also included is a methodfor exploring upward and downward targets using the 3-RCI-lines..
The explanations in the PDF file useover 1,200 charts.

and methods / case studies (PDF) ★GogoJungle AWARD2020 winner★
https://www.gogojungle.co.jp/tools/indicators/11836
USD/JPY 5-minute chart
The higher time-frame context is omitted. On the upper 5-minute chart, after breaking above the retrace high, prices have declined. Subsequently, as prices rose again and during the ascentmBDSR (2-line RCI) pullback buy signallights up, and the price shows a solid upward move.
As a resultRCI52 (long-term RCI)has risen to cling near the top of the range (around the yellow square).
In the above example,Using the 3-RCI-lineto logically link higher and lower time-frames allows you toexplore the upward target of the RCI, but a detailed explanation of this technique is left to the attached PDF below.
Attachment PDF file #322【mBDSRhint1322_20241009.pdf】
“[Important] Thinking about the upward target using 3-RCI-lines (8)”
※ Please note that for convenience in this article, charts may include added circles, lines, and boxes for explanatory purposes.
Indicator that shines in combination with RCI: BODSOR・mBDSR
and methods / case studies (PDF) ★GogoJungle AWARD2020 winner★
https://www.gogojungle.co.jp/tools/indicators/11836
The PDF file includes 341 attachments (over 1,200 pages, over 430,000 words in total).
Many of these are examples that, by using the 3-RCI-lines to logically link higher and lower time-frames, analyze the multiple lower-time-frame conditions sequentially, ultimately outlining a setup on the lower time-frame to wait for a pullback buy or retracement sell signal from mBDSR.there are many that emphasize pinpointing points where multiple entry reasons converge.In addition,
.
Also included is a methodfor exploring upward and downward targets using the 3-RCI-lines..
The explanations in the PDF file useover 1,200 charts.
× ![]()


