

Return-sell signal of the resistance line, double top, and mBDSR (RCI2 two-filter)
===============================
【Special Video vol.01/Blacksun】
https://www.gogojungle.co.jp/info/22955
【Special Video vol.02/Blacksun】
https://www.gogojungle.co.jp/info/22956
【Special Video vol.03/Blacksun】
https://www.gogojungle.co.jp/info/22957
===============================
【MT5 Version Beta】 has been released!!
mBDSR (Product ID 11836) Purchase Benefit】 MT5 Indicator (Beta) “mBDSR (No filter, RCI filter, MA filter)”
https://www.gogojungle.co.jp/tools/indicators/56765
【Master RCI!! Trend Reversal, Buy on Dips, Sell on Rallies】
An indicator that shines when combined with RCI【BODSOR・mBDSR】
and methodology / case studies (PDF) ★GogoJungle AWARD2020Winner★
https://www.gogojungle.co.jp/tools/indicators/11836
New Zealand Swiss NZDCHF 30-minute chart
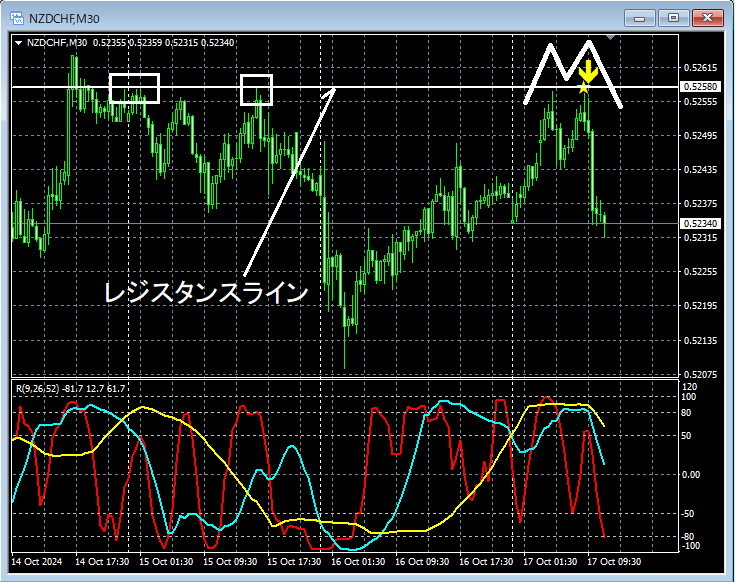
I will omit the status of the higher time frame. Looking at the 30-minute chart above,the price rose up to near the resistance line,the mBDSR (2 RCI filter) sell-back signalturned on. Then, the price clearly moved down. As a result,a double topformed with the signal lighting up on the right peak.
Rise up to the resistance lineandthe mBDSR (2 RCI filter) sell-back signal turning onoverlapped as multiple entry bases.
From this example,the trading method focusing on the previous highandthe signal of mBDSRshow a strong compatibility.
※Please note that in the charts introduced in this article, for ease of explanation, circles, lines, and rectangles may have been drawn.
The Indicator that shines when combined with RCI【BODSOR・mBDSR】
and methodology / case studies (PDF) ★GogoJungle AWARD2020 Winner★
https://www.gogojungle.co.jp/tools/indicators/11836
The PDF file includes 358 files (over 1,400 pages, over 470,000 characters).
Most of them aresummaries of how to logically link higher and lower time frames using 3-line RCI, then progressively analyze multiple lower time frames, finally waiting for the timing to buy on dips or sell on rallies on the lower time frame (i.e., the mBDSR signal).
In addition,many focus on capturing points where multiple entry bases coincide.
Also included is a method for exploring upside and downside targets using 3-line RCI.
In the PDF explanations,more than 1,350 charts are used.

【Special Video vol.01/Blacksun】
https://www.gogojungle.co.jp/info/22955
【Special Video vol.02/Blacksun】
https://www.gogojungle.co.jp/info/22956
【Special Video vol.03/Blacksun】
https://www.gogojungle.co.jp/info/22957
===============================
【MT5 Version Beta】 has been released!!
mBDSR (Product ID 11836) Purchase Benefit】 MT5 Indicator (Beta) “mBDSR (No filter, RCI filter, MA filter)”
https://www.gogojungle.co.jp/tools/indicators/56765
【Master RCI!! Trend Reversal, Buy on Dips, Sell on Rallies】
An indicator that shines when combined with RCI【BODSOR・mBDSR】
and methodology / case studies (PDF) ★GogoJungle AWARD2020Winner★
https://www.gogojungle.co.jp/tools/indicators/11836
New Zealand Swiss NZDCHF 30-minute chart
I will omit the status of the higher time frame. Looking at the 30-minute chart above,the price rose up to near the resistance line,the mBDSR (2 RCI filter) sell-back signalturned on. Then, the price clearly moved down. As a result,a double topformed with the signal lighting up on the right peak.
Rise up to the resistance lineandthe mBDSR (2 RCI filter) sell-back signal turning onoverlapped as multiple entry bases.
From this example,the trading method focusing on the previous highandthe signal of mBDSRshow a strong compatibility.
※Please note that in the charts introduced in this article, for ease of explanation, circles, lines, and rectangles may have been drawn.
The Indicator that shines when combined with RCI【BODSOR・mBDSR】
and methodology / case studies (PDF) ★GogoJungle AWARD2020 Winner★
https://www.gogojungle.co.jp/tools/indicators/11836
The PDF file includes 358 files (over 1,400 pages, over 470,000 characters).
Most of them aresummaries of how to logically link higher and lower time frames using 3-line RCI, then progressively analyze multiple lower time frames, finally waiting for the timing to buy on dips or sell on rallies on the lower time frame (i.e., the mBDSR signal).
In addition,many focus on capturing points where multiple entry bases coincide.
Also included is a method for exploring upside and downside targets using 3-line RCI.
In the PDF explanations,more than 1,350 charts are used.
× ![]()


