

[Multiple Entries Basis] Sell signal on pullback using moving average, double top, counter-trend line, and mBDSR (RCI two-filter)
============
【Special Video vol.01/Blacksun】
https://www.gogojungle.co.jp/info/22955
【Special Video vol.02/Blacksun】
https://www.gogojungle.co.jp/info/22956
【Special Video vol.03/Blacksun】
https://www.gogojungle.co.jp/info/22957
============
The MT5 Version Beta has been released!!
mBDSR (Product ID 11836) Purchase Benefit】 MT5 Indicator (Beta) “mBDSR (No filter, RCI filter, MA filter)”
https://www.gogojungle.co.jp/tools/indicators/56765
【Master RCI!! Trend Reversal, Buy on Dips, Sell on Rallies】
An indicator that shines when used in combination with RCI【BODSOR・mBDSR】
and techniques / case studies (PDF) ★GogoJungle AWARD2020 Winner★
https://www.gogojungle.co.jp/tools/indicators/11836
GBP/USD CAD 5-minute chart
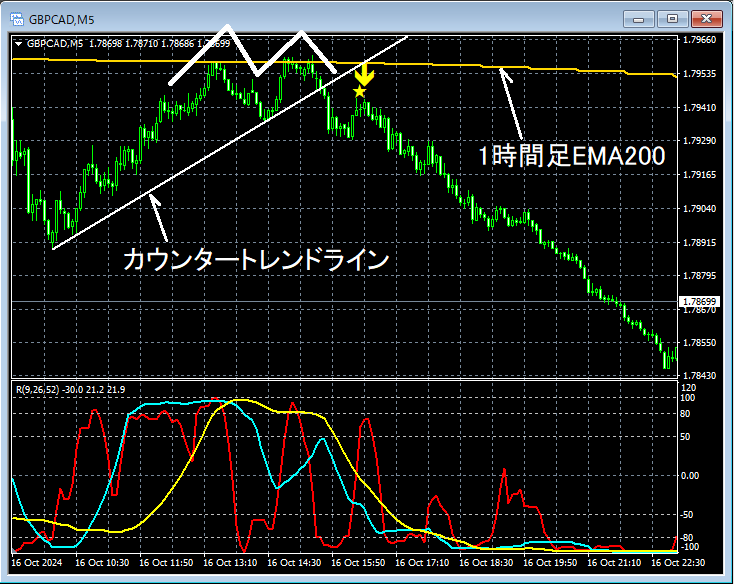
Regarding higher timeframes, omitted. On the 5-minute chart above,near the 1-hour EMA 200around whicha double topis formed and price reverses. In the middle,counter-trend linewas broken to the downside and then rose againthe mBDSR (RCI two-filter) overbought signalappeared, followed by a sharp decline.
Reversal near important moving averagesandthe double top formationandthe counter-trend line breakoutandthe mBDSR overbought signaloverlap as multiple entry bases.
From this example,you can see the synergy between trading methods that focus on moving averages, double tops, and counter-trend linesandthe mBDSR signalsare strong.
Note: In this article, some charts include added circles, lines, and rectangles for clarity.
The indicator that shines in combination with RCI【BODSOR・mBDSR】
and techniques / case studies (PDF) ★GogoJungle AWARD2020 Winner★
https://www.gogojungle.co.jp/tools/indicators/11836
The PDF folder includes 358 files (over 1,400 pages, over 470,000 characters).
Many of these are structured to logically link higher and lower timeframes using three RCI lines, examining multiple lower-timeframe conditions progressively, and ultimately timing a dip-buy or rally-sell on the lower timeframe (i.e., the mBDSR signal).there are many entries that focus on overlapping multiple entry signals.Also,
Additionally,
In the PDF explanations,over 1,350 chartsare used.

【Special Video vol.01/Blacksun】
https://www.gogojungle.co.jp/info/22955
【Special Video vol.02/Blacksun】
https://www.gogojungle.co.jp/info/22956
【Special Video vol.03/Blacksun】
https://www.gogojungle.co.jp/info/22957
============
The MT5 Version Beta has been released!!
mBDSR (Product ID 11836) Purchase Benefit】 MT5 Indicator (Beta) “mBDSR (No filter, RCI filter, MA filter)”
https://www.gogojungle.co.jp/tools/indicators/56765
【Master RCI!! Trend Reversal, Buy on Dips, Sell on Rallies】
An indicator that shines when used in combination with RCI【BODSOR・mBDSR】
and techniques / case studies (PDF) ★GogoJungle AWARD2020 Winner★
https://www.gogojungle.co.jp/tools/indicators/11836
GBP/USD CAD 5-minute chart
Regarding higher timeframes, omitted. On the 5-minute chart above,near the 1-hour EMA 200around whicha double topis formed and price reverses. In the middle,counter-trend linewas broken to the downside and then rose againthe mBDSR (RCI two-filter) overbought signalappeared, followed by a sharp decline.
Reversal near important moving averagesandthe double top formationandthe counter-trend line breakoutandthe mBDSR overbought signaloverlap as multiple entry bases.
From this example,you can see the synergy between trading methods that focus on moving averages, double tops, and counter-trend linesandthe mBDSR signalsare strong.
Note: In this article, some charts include added circles, lines, and rectangles for clarity.
The indicator that shines in combination with RCI【BODSOR・mBDSR】
and techniques / case studies (PDF) ★GogoJungle AWARD2020 Winner★
https://www.gogojungle.co.jp/tools/indicators/11836
The PDF folder includes 358 files (over 1,400 pages, over 470,000 characters).
Many of these are structured to logically link higher and lower timeframes using three RCI lines, examining multiple lower-timeframe conditions progressively, and ultimately timing a dip-buy or rally-sell on the lower timeframe (i.e., the mBDSR signal).there are many entries that focus on overlapping multiple entry signals.Also,
Additionally,
In the PDF explanations,over 1,350 chartsare used.
× ![]()


