

[Multiple Entry Justifications] Sell signal on rebound using moving average, counter-trend line, and mBDSR (RCI with 2 filters)
====================
【Special Video vol.01/Blacksun】
https://www.gogojungle.co.jp/info/22955
【Special Video vol.02/Blacksun】
https://www.gogojungle.co.jp/info/22956
【Special Video vol.03/Blacksun】
https://www.gogojungle.co.jp/info/22957
====================
【MT5 Version Beta】 has been released!!
mBDSR (Product ID 11836) Purchase Bonus】 MT5 Version Indicator (Beta) “mBDSR (No Filters, RCI Filter, MA Filter)”
https://www.gogojungle.co.jp/tools/indicators/56765
【Master RCI!! Trend Reversal, Buy on Dips, Sell on Rallies】
An indicator that delivers power when combined with RCI【BODSOR・mBDSR】
and methods & case studies (PDF) ★GogoJungle AWARD2020 Winner★
https://www.gogojungle.co.jp/tools/indicators/11836
New Zealand Dollar / US Dollar NZDUSD 5-minute chart
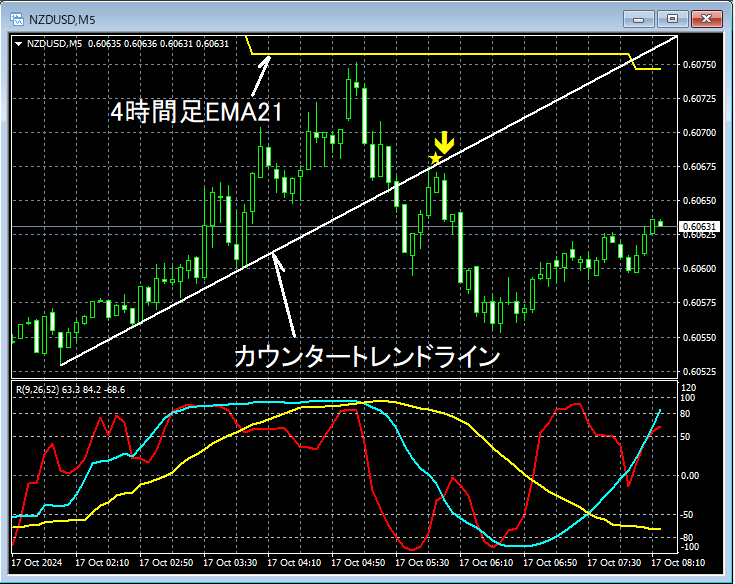
Details of higher timeframes are omitted. In the upper 5-minute chart,near the 4-hour EMA21there is a reboundand after breaking below the counter-trend linethe rebound signal of mBDSR (2 RCI filters) lights upand then declines sharply.
A rebound near the important moving averagesandbreak below the counter-trend lineandthe mBDSR rebound sell signal lights upindicate multiple entry reasons overlapping.
From this example,it can be seen that a trading method focusing on moving averages and counter-trend linesand the signals of mBDSRhave high compatibility.
※ Please note that in the charts introduced in this article, circles, lines, and rectangles may have been added for explanatory convenience.
Indictor with power when combined with RCI【BODSOR・mBDSR】
and methods & case studies (PDF) ★GogoJungle AWARD2020 Winner★
https://www.gogojungle.co.jp/tools/indicators/11836
The PDF file contains 358 items (over 1,400 pages, over 470,000 words).
Many of these areexamples that lay out a process of logically linking higher and lower timeframes using 3-line RCI to progressively examine multiple lower-timeframe conditions, ultimately waiting for a dip buy or a pullback sell timing (i.e., mBDSR signals) on the lower timeframe..
Additionally,many focus on capturing points where multiple entry reasons overlap..
Also included is a method to explore upside and downside targets using the 3-line RCI.
In the PDF explanations,more than 1,350 chartsare used.

【Special Video vol.01/Blacksun】
https://www.gogojungle.co.jp/info/22955
【Special Video vol.02/Blacksun】
https://www.gogojungle.co.jp/info/22956
【Special Video vol.03/Blacksun】
https://www.gogojungle.co.jp/info/22957
====================
【MT5 Version Beta】 has been released!!
mBDSR (Product ID 11836) Purchase Bonus】 MT5 Version Indicator (Beta) “mBDSR (No Filters, RCI Filter, MA Filter)”
https://www.gogojungle.co.jp/tools/indicators/56765
【Master RCI!! Trend Reversal, Buy on Dips, Sell on Rallies】
An indicator that delivers power when combined with RCI【BODSOR・mBDSR】
and methods & case studies (PDF) ★GogoJungle AWARD2020 Winner★
https://www.gogojungle.co.jp/tools/indicators/11836
New Zealand Dollar / US Dollar NZDUSD 5-minute chart
Details of higher timeframes are omitted. In the upper 5-minute chart,near the 4-hour EMA21there is a reboundand after breaking below the counter-trend linethe rebound signal of mBDSR (2 RCI filters) lights upand then declines sharply.
A rebound near the important moving averagesandbreak below the counter-trend lineandthe mBDSR rebound sell signal lights upindicate multiple entry reasons overlapping.
From this example,it can be seen that a trading method focusing on moving averages and counter-trend linesand the signals of mBDSRhave high compatibility.
※ Please note that in the charts introduced in this article, circles, lines, and rectangles may have been added for explanatory convenience.
Indictor with power when combined with RCI【BODSOR・mBDSR】
and methods & case studies (PDF) ★GogoJungle AWARD2020 Winner★
https://www.gogojungle.co.jp/tools/indicators/11836
The PDF file contains 358 items (over 1,400 pages, over 470,000 words).
Many of these areexamples that lay out a process of logically linking higher and lower timeframes using 3-line RCI to progressively examine multiple lower-timeframe conditions, ultimately waiting for a dip buy or a pullback sell timing (i.e., mBDSR signals) on the lower timeframe..
Additionally,many focus on capturing points where multiple entry reasons overlap..
Also included is a method to explore upside and downside targets using the 3-line RCI.
In the PDF explanations,more than 1,350 chartsare used.
× ![]()


