

Consider take-profit targets using three-line RCI (14)
0
【Mastering RCI!! Trend Reversal, Buy on Dips, Sell on Rallies】
Indicator that excels in combination with RCI: 【BODSOR・mBDSR】
Methods, and Case Studies (PDF) ★GogoJungle AWARD2020 Winner★
https://www.gogojungle.co.jp/tools/indicators/11836
USDJPY - 1 hour chart
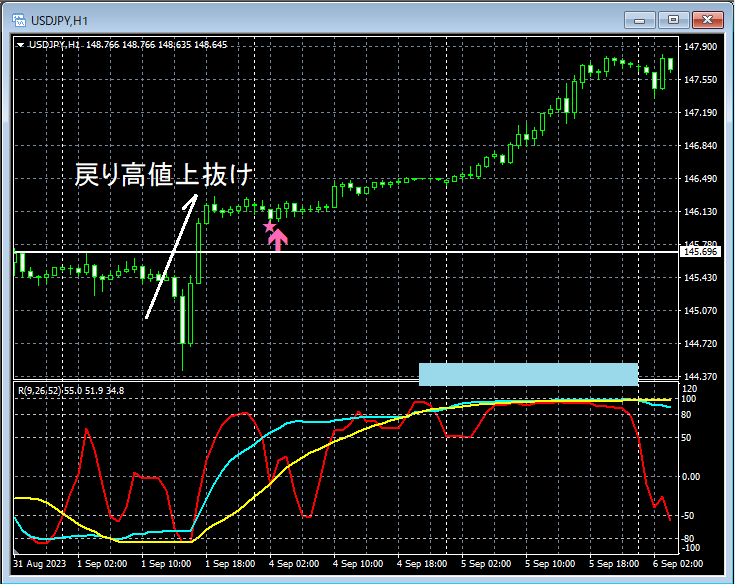
The status of higher timeframes is omitted. On the one-hour chart above,Pullback highafter breaking abovemBDSR (RCI two-line filter) buy-on-dip signalis lit, and the price is rising firmly.
As a resultRCI26 (mid-term RCI)continues to rise until it reaches the peak area (around the light blue square).
In the above example,Using the three RCI linesto logically link higher and lower timeframes,you can explore price targets for RCI climbs, but a detailed explanation of that method is left to the attached PDF below.
The 318th attached PDF file 【mBDSRhint1318_20241005V1.pdf】
「【Important】Thinking about ascent targets using the 3-line RCI (5)」
※ Please note that in the charts shown in this article, for convenience of explanation, circles, lines, and boxes may be drawn.
Indicator that excels in combination with RCI: 【BODSOR・mBDSR】
Methods and Case Studies (PDF) ★GogoJungle AWARD2020 Winner★
https://www.gogojungle.co.jp/tools/indicators/11836
The PDF file includes 341 items (over 1,200 pages, over 430,000 characters in total).
Many of them are designed to logically link higher and lower timeframes using the 3-line RCI, sequentially considering the status of multiple lower timeframes, and ultimately waiting for a dip buy or rally sell timing (i.e., the mBDSR signal) on the lower timeframes.This is a compilation of such examples.
Also,many focus on identifying points where multiple entry justifications overlap..
Additionally,there are methods that explore ascent and descent targets using the three-line RCI..
In the PDF explanations,more than 1,200 chartsare used.

Indicator that excels in combination with RCI: 【BODSOR・mBDSR】
Methods, and Case Studies (PDF) ★GogoJungle AWARD2020 Winner★
https://www.gogojungle.co.jp/tools/indicators/11836
USDJPY - 1 hour chart
The status of higher timeframes is omitted. On the one-hour chart above,Pullback highafter breaking abovemBDSR (RCI two-line filter) buy-on-dip signalis lit, and the price is rising firmly.
As a resultRCI26 (mid-term RCI)continues to rise until it reaches the peak area (around the light blue square).
In the above example,Using the three RCI linesto logically link higher and lower timeframes,you can explore price targets for RCI climbs, but a detailed explanation of that method is left to the attached PDF below.
The 318th attached PDF file 【mBDSRhint1318_20241005V1.pdf】
「【Important】Thinking about ascent targets using the 3-line RCI (5)」
※ Please note that in the charts shown in this article, for convenience of explanation, circles, lines, and boxes may be drawn.
Indicator that excels in combination with RCI: 【BODSOR・mBDSR】
Methods and Case Studies (PDF) ★GogoJungle AWARD2020 Winner★
https://www.gogojungle.co.jp/tools/indicators/11836
The PDF file includes 341 items (over 1,200 pages, over 430,000 characters in total).
Many of them are designed to logically link higher and lower timeframes using the 3-line RCI, sequentially considering the status of multiple lower timeframes, and ultimately waiting for a dip buy or rally sell timing (i.e., the mBDSR signal) on the lower timeframes.This is a compilation of such examples.
Also,many focus on identifying points where multiple entry justifications overlap..
Additionally,there are methods that explore ascent and descent targets using the three-line RCI..
In the PDF explanations,more than 1,200 chartsare used.
× ![]()


