

Consider taking profit targets using this single line (13)
An indicator that demonstrates its power when combined with RCI: BODSOR・mBDSR
Methods and Case Studies (PDF) ★GogoJungle AWARD2020 Winner★
https://www.gogojungle.co.jp/tools/indicators/11836
Pound/Dollar GBPUSD 1-minute chart
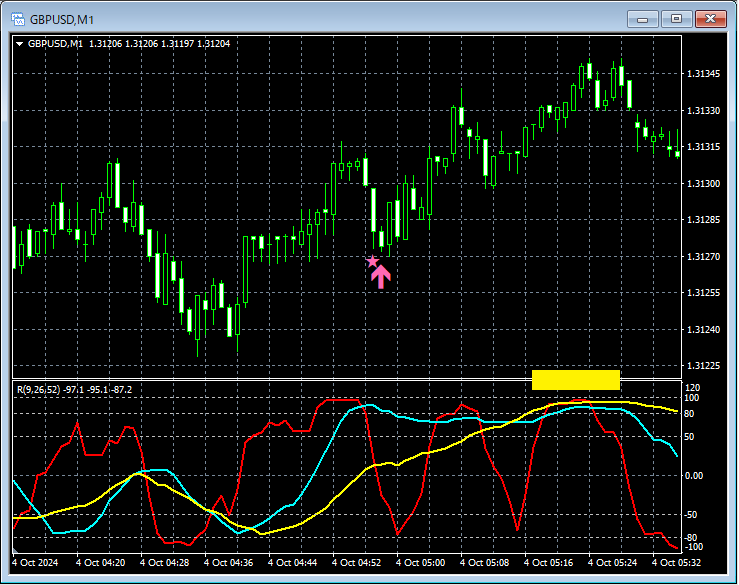
The higher timeframe outlook is omitted. On the above 1-minute chart,mBDSR (two RCI lines) pullback buying signallights up, and the price is clearly rising.
As a resultRCI52 (long-term RCI)continues to rise toward the upper resistance area (around the yellow boxed area).
In the above example,RCI three-line strategylinks higher and lower timeframes logically,to explore the upward target of RCI; for a detailed explanation of this method, please refer to the attached PDF below.
316th attached PDF file 【mBDSRhint1316_20241005V1.pdf】
「[Important] Using three-line RCI to consider the upward target (3)」
※ Please note that the charts shown in this article may include circles, straight lines, and rectangles for convenience of explanation.
An indicator that demonstrates its power when combined with RCI: BODSOR・mBDSR
Methods and Case Studies (PDF) ★GogoJungle AWARD2020 Winner★
https://www.gogojungle.co.jp/tools/indicators/11836
The PDF file includes 333 items (over 1,200 pages, over 420,000 words in total).
Many of these areExamples that logically link the higher and lower timeframes using three-line RCI, sequentially examining the conditions of multiple lower timeframes, and ultimately waiting for pullback buying or retracement selling signals on the lower timeframes (i.e., mBDSR signals).
Additionally,many focus on pinpointing points where multiple entry reasons converge.
Furthermore,the method for exploring upward or downward targets using three-line RCI is also included..
In the PDF explanations,more than 1,200 chartsare used.

Methods and Case Studies (PDF) ★GogoJungle AWARD2020 Winner★
https://www.gogojungle.co.jp/tools/indicators/11836
Pound/Dollar GBPUSD 1-minute chart
The higher timeframe outlook is omitted. On the above 1-minute chart,mBDSR (two RCI lines) pullback buying signallights up, and the price is clearly rising.
As a resultRCI52 (long-term RCI)continues to rise toward the upper resistance area (around the yellow boxed area).
In the above example,RCI three-line strategylinks higher and lower timeframes logically,to explore the upward target of RCI; for a detailed explanation of this method, please refer to the attached PDF below.
316th attached PDF file 【mBDSRhint1316_20241005V1.pdf】
「[Important] Using three-line RCI to consider the upward target (3)」
※ Please note that the charts shown in this article may include circles, straight lines, and rectangles for convenience of explanation.
An indicator that demonstrates its power when combined with RCI: BODSOR・mBDSR
Methods and Case Studies (PDF) ★GogoJungle AWARD2020 Winner★
https://www.gogojungle.co.jp/tools/indicators/11836
The PDF file includes 333 items (over 1,200 pages, over 420,000 words in total).
Many of these areExamples that logically link the higher and lower timeframes using three-line RCI, sequentially examining the conditions of multiple lower timeframes, and ultimately waiting for pullback buying or retracement selling signals on the lower timeframes (i.e., mBDSR signals).
Additionally,many focus on pinpointing points where multiple entry reasons converge.
Furthermore,the method for exploring upward or downward targets using three-line RCI is also included..
In the PDF explanations,more than 1,200 chartsare used.
× ![]()


