

Consider profit-taking targets using this single line RCI3 (12)
An indicator that shows power when combined with RCI: 【BODSOR・mBDSR】
Methods and Case Studies (PDF) ★GogoJungle AWARD2020 winner★
https://www.gogojungle.co.jp/tools/indicators/11836
EURJPY 5-minute chart
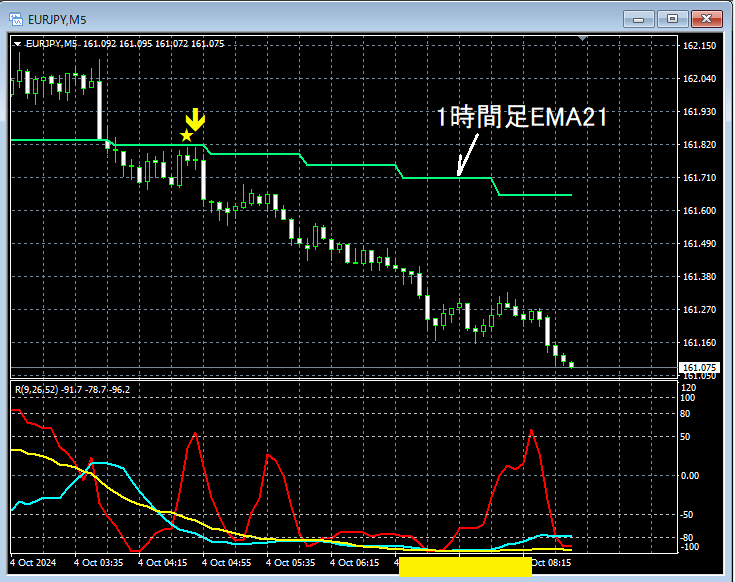
Upper timeframes are omitted. On the above 5-minute chart,the EMA21 on the 1-hour chartdrops below and then rises,mBDSR (two RCI lines filter) sell signallights up, and the price stays firmly lower.
As a result,RCI52 (long-term RCI)continues falling to the bottom area (around the yellow box).
In the above example,using the three RCI linesto logically link the higher and lower timeframes,one can look for the downtrend targets of RCI; details of this method are left to the attached PDF below.
315th attached PDF file 【mBDSRhint1315_20241004.pdf】
「[Important] Thinking of downside targets using the 3-line RCI (9)」
Please note that the charts mentioned in this article may include added circles, lines, or boxes for explanatory convenience.
An indicator that shows power when combined with RCI: 【BODSOR・mBDSR】
Methods and Case Studies (PDF) ★GogoJungle AWARD2020 winner★
https://www.gogojungle.co.jp/tools/indicators/11836
The PDF file comes with 333 items (over 1,200 pages, over 420,000 words in total).
Most of these are examples that summarize how to logically link higher and lower timeframes using the three-line RCI, work through multiple lower-timeframe conditions in sequence, and ultimately wait for a pullback or a return in the lower timeframes (i.e., signals from mBDSR).
Also,many items emphasize identifying points where multiple entry reasons overlap.There are also many such cases.
Additionally,there are methods that explore upside and downside targets using the three-line RCI.The explanations in the PDF include
over 1,200 chartsbeing used.

Methods and Case Studies (PDF) ★GogoJungle AWARD2020 winner★
https://www.gogojungle.co.jp/tools/indicators/11836
EURJPY 5-minute chart
Upper timeframes are omitted. On the above 5-minute chart,the EMA21 on the 1-hour chartdrops below and then rises,mBDSR (two RCI lines filter) sell signallights up, and the price stays firmly lower.
As a result,RCI52 (long-term RCI)continues falling to the bottom area (around the yellow box).
In the above example,using the three RCI linesto logically link the higher and lower timeframes,one can look for the downtrend targets of RCI; details of this method are left to the attached PDF below.
315th attached PDF file 【mBDSRhint1315_20241004.pdf】
「[Important] Thinking of downside targets using the 3-line RCI (9)」
Please note that the charts mentioned in this article may include added circles, lines, or boxes for explanatory convenience.
An indicator that shows power when combined with RCI: 【BODSOR・mBDSR】
Methods and Case Studies (PDF) ★GogoJungle AWARD2020 winner★
https://www.gogojungle.co.jp/tools/indicators/11836
The PDF file comes with 333 items (over 1,200 pages, over 420,000 words in total).
Most of these are examples that summarize how to logically link higher and lower timeframes using the three-line RCI, work through multiple lower-timeframe conditions in sequence, and ultimately wait for a pullback or a return in the lower timeframes (i.e., signals from mBDSR).
Also,many items emphasize identifying points where multiple entry reasons overlap.There are also many such cases.
Additionally,there are methods that explore upside and downside targets using the three-line RCI.The explanations in the PDF include
over 1,200 chartsbeing used.
× ![]()


