

Consider profit-taking targets using the RCI 3-line method (11)
0
Indicator 【BODSOR・mBDSR】 that shines when combined with RCI
Method, and Case Study (PDF) ★GogoJungle AWARD2020 winner★
https://www.gogojungle.co.jp/tools/indicators/11836
EURJPY – Euro/Yen – 4-hour chart
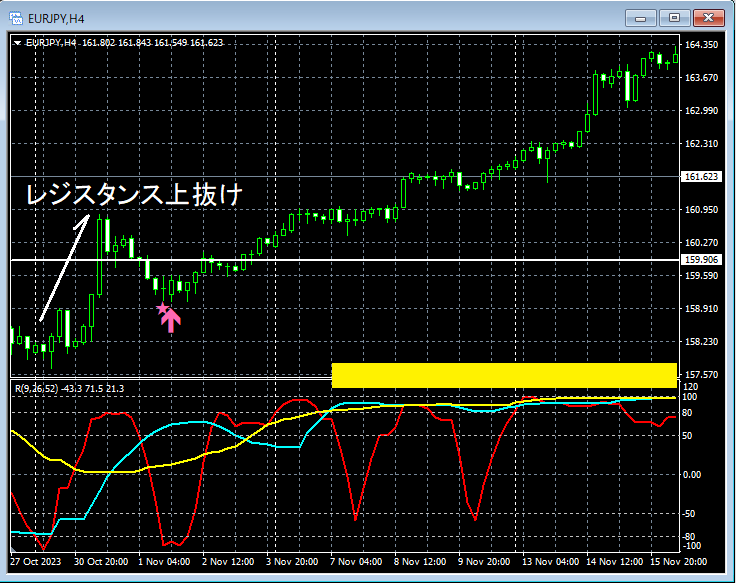
The higher-timeframe status is omitted. On the above 4-hour chart,Resistanceis broken to the upside, and on the pullbackmBDSR (RCI two-line filter) buy signallights up, and price is moving higher firmly.
As a resultRCI52 (long-term RCI)is coming down toward the ceiling area (around the yellow box).
In the above example,Three-line RCIis used to logically link higher and lower timeframes,to gauge the upward target for RCI, but a detailed explanation of that method is left to the attached PDF below.
附属PDF file #314【mBDSRhint1314_20241006V2.pdf】
「【Important】Thinking about the ascent target using three RCI lines (2)」
※Please note that in the charts presented in this article, for convenience of explanation, circles, straight lines, and squares may be drawn.
Indicator 【BODSOR・mBDSR】 that shines when combined with RCI
Method and Case Study (PDF) ★GogoJungle AWARD2020 winner★
https://www.gogojungle.co.jp/tools/indicators/11836
The PDF file includes 325 items (over 1,200 pages, over 400,000 characters).
Many of them areexamples that summarize a process of logically linking higher and lower timeframes using the three-line RCI, examining multiple lower-timeframe conditions in sequence, and ultimately waiting for a buy pullback or sell rebound timing (i.e., mBDSR signal) on the lower timeframes..
Additionally,many focus on capturing points where multiple entry reasons overlap.There are many such cases.
Note that,the material also includes a method for exploring upward and downward targets using the three-line RCI..
In the PDF explanations,over 1,200 chartsare used.

Method, and Case Study (PDF) ★GogoJungle AWARD2020 winner★
https://www.gogojungle.co.jp/tools/indicators/11836
EURJPY – Euro/Yen – 4-hour chart
The higher-timeframe status is omitted. On the above 4-hour chart,Resistanceis broken to the upside, and on the pullbackmBDSR (RCI two-line filter) buy signallights up, and price is moving higher firmly.
As a resultRCI52 (long-term RCI)is coming down toward the ceiling area (around the yellow box).
In the above example,Three-line RCIis used to logically link higher and lower timeframes,to gauge the upward target for RCI, but a detailed explanation of that method is left to the attached PDF below.
附属PDF file #314【mBDSRhint1314_20241006V2.pdf】
「【Important】Thinking about the ascent target using three RCI lines (2)」
※Please note that in the charts presented in this article, for convenience of explanation, circles, straight lines, and squares may be drawn.
Indicator 【BODSOR・mBDSR】 that shines when combined with RCI
Method and Case Study (PDF) ★GogoJungle AWARD2020 winner★
https://www.gogojungle.co.jp/tools/indicators/11836
The PDF file includes 325 items (over 1,200 pages, over 400,000 characters).
Many of them areexamples that summarize a process of logically linking higher and lower timeframes using the three-line RCI, examining multiple lower-timeframe conditions in sequence, and ultimately waiting for a buy pullback or sell rebound timing (i.e., mBDSR signal) on the lower timeframes..
Additionally,many focus on capturing points where multiple entry reasons overlap.There are many such cases.
Note that,the material also includes a method for exploring upward and downward targets using the three-line RCI..
In the PDF explanations,over 1,200 chartsare used.
× ![]()


