

Consider taking profit targets using RCI3 single line (10)
Indicator that shines in combination with RCI: 【BODSOR・mBDSR】
Method and Case Study (PDF) ★GogoJungle AWARD2020 Winner★
https://www.gogojungle.co.jp/tools/indicators/11836
USD/CAD Daily
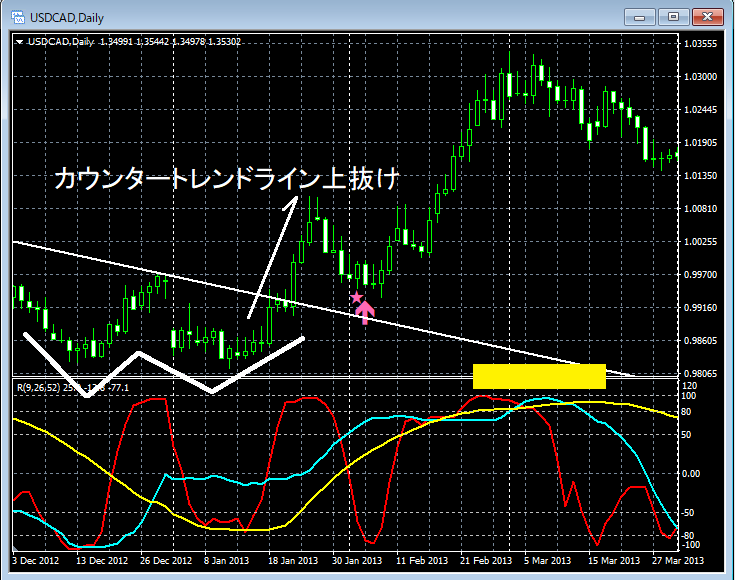
The status on higher timeframes is omitted. On the above daily chart,Counter-trend lineis broken upward, forming aDouble Bottomand rising. In the subsequent pullback,mBDSR (RCI two-lines filter) buy signallights up, and price continues to rise firmly.
As a result,RCI52 (Long-term RCI)pulls back until it reaches the ceiling zone (around the yellow box).
In the above example,Three-line RCIis used to logically link the higher and lower timeframes,to explore the upper targets for RCI, but detailed explanations of this method are left to the attached PDF below.
Attached PDF file 313【mBDSRhint1313_20241006V1.pdf】
“[Important] Considering Upward Potential Using Three-Line RCI (Part 1)”
Note: In the charts presented in this article, for convenience of explanation, circles, lines, and boxes may be drawn, so please understand.
Indicator that shines in combination with RCI: 【BODSOR・mBDSR】
Method and Case Study (PDF) ★GogoJungle AWARD2020 Winner★
https://www.gogojungle.co.jp/tools/indicators/11836
The PDF file includes 325 files (over 1,200 pages, over 400,000 words) in total.
Most of them are.They summarize examples where multiple lower-timeframe conditions are examined in sequence by logically linking higher and lower timeframes with the three-line RCI, ultimately waiting for pullbacks or dips on lower timeframes (i.e., signals of mBDSR).That is the gist.
Furthermore,many focus on identifying points where multiple entry reasons coincide..
Also,it includes methods for exploring upward and downward targets using three-line RCI..
In the PDF explanations,over 1,200 chartsare used.

Method and Case Study (PDF) ★GogoJungle AWARD2020 Winner★
https://www.gogojungle.co.jp/tools/indicators/11836
USD/CAD Daily
The status on higher timeframes is omitted. On the above daily chart,Counter-trend lineis broken upward, forming aDouble Bottomand rising. In the subsequent pullback,mBDSR (RCI two-lines filter) buy signallights up, and price continues to rise firmly.
As a result,RCI52 (Long-term RCI)pulls back until it reaches the ceiling zone (around the yellow box).
In the above example,Three-line RCIis used to logically link the higher and lower timeframes,to explore the upper targets for RCI, but detailed explanations of this method are left to the attached PDF below.
Attached PDF file 313【mBDSRhint1313_20241006V1.pdf】
“[Important] Considering Upward Potential Using Three-Line RCI (Part 1)”
Note: In the charts presented in this article, for convenience of explanation, circles, lines, and boxes may be drawn, so please understand.
Indicator that shines in combination with RCI: 【BODSOR・mBDSR】
Method and Case Study (PDF) ★GogoJungle AWARD2020 Winner★
https://www.gogojungle.co.jp/tools/indicators/11836
The PDF file includes 325 files (over 1,200 pages, over 400,000 words) in total.
Most of them are.They summarize examples where multiple lower-timeframe conditions are examined in sequence by logically linking higher and lower timeframes with the three-line RCI, ultimately waiting for pullbacks or dips on lower timeframes (i.e., signals of mBDSR).That is the gist.
Furthermore,many focus on identifying points where multiple entry reasons coincide..
Also,it includes methods for exploring upward and downward targets using three-line RCI..
In the PDF explanations,over 1,200 chartsare used.
× ![]()


