

【Nikkei 225 JP225】R-C-I 3-line main trend, retracement high, and mBDSR pullback buy signal
0
Indicator 【BODSOR・mBDSR】 that shows power when combined with RCI
Methods and Case Studies (PDF) ★GogoJungle AWARD2020 Winner★
https://www.gogojungle.co.jp/tools/indicators/11836
Nikkei Average JP225 15-minute chart
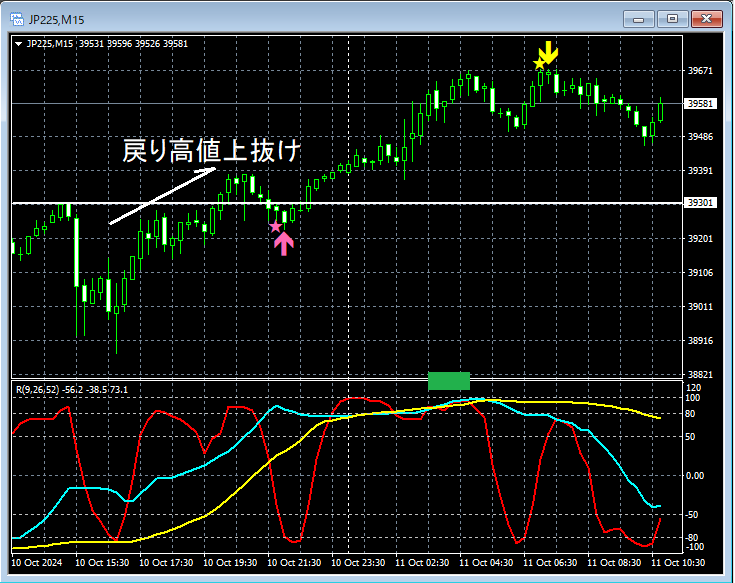
Looking at the 15-minute chart above,the price breaks above the retracement highand then from there,mBDSR (two RCI lines filter) buy signallights up, and subsequently the price rises firmly. And,RCI three-lineis, so to speak,“RCI triple top”shape (around the green rectangle) is reached.
From this example,the trading approach focused on Dow Theoryandthe signals of mBDSRshow a strong alignment/compatibility.
※Please note that in the charts introduced in this article, for convenience of explanation, circles, straight lines, and rectangles may be added.
Indicator 【BODSOR・mBDSR】 that shows power when combined with RCI
Methods and Case Studies (PDF) ★GogoJungle AWARD2020 Winner★
https://www.gogojungle.co.jp/tools/indicators/11836
The PDF file contains 325 items (over 1,200 pages, over 400,000 characters).
Many of them aresummaries of cases where the upper and lower timeframes are logically linked using three RCI lines, examining multiple lower timeframes step by step, and ultimately waiting for pullbacks or retracements (i.e., mBDSR signals) on the lower timeframes..
Additionally,there are many that focus on identifying points where multiple entry reasons coincide..
Furthermore,there are methods that use three RCI lines to explore upward and downward targets..
In the descriptions in the PDF file,over 1,200 chartsare used.

Methods and Case Studies (PDF) ★GogoJungle AWARD2020 Winner★
https://www.gogojungle.co.jp/tools/indicators/11836
Nikkei Average JP225 15-minute chart
Looking at the 15-minute chart above,the price breaks above the retracement highand then from there,mBDSR (two RCI lines filter) buy signallights up, and subsequently the price rises firmly. And,RCI three-lineis, so to speak,“RCI triple top”shape (around the green rectangle) is reached.
From this example,the trading approach focused on Dow Theoryandthe signals of mBDSRshow a strong alignment/compatibility.
※Please note that in the charts introduced in this article, for convenience of explanation, circles, straight lines, and rectangles may be added.
Indicator 【BODSOR・mBDSR】 that shows power when combined with RCI
Methods and Case Studies (PDF) ★GogoJungle AWARD2020 Winner★
https://www.gogojungle.co.jp/tools/indicators/11836
The PDF file contains 325 items (over 1,200 pages, over 400,000 characters).
Many of them aresummaries of cases where the upper and lower timeframes are logically linked using three RCI lines, examining multiple lower timeframes step by step, and ultimately waiting for pullbacks or retracements (i.e., mBDSR signals) on the lower timeframes..
Additionally,there are many that focus on identifying points where multiple entry reasons coincide..
Furthermore,there are methods that use three RCI lines to explore upward and downward targets..
In the descriptions in the PDF file,over 1,200 chartsare used.
× ![]()


