

Consider profit-taking targets using RCI3 main line (9)
Indicator "BODSOR・mBDSR" that shines in combination with RCI
and Method & Case Studies (PDF) ★GogoJungle AWARD2020 winner★
https://www.gogojungle.co.jp/tools/indicators/11836
Pound / Canadian Dollar GBP/CAD Weekly
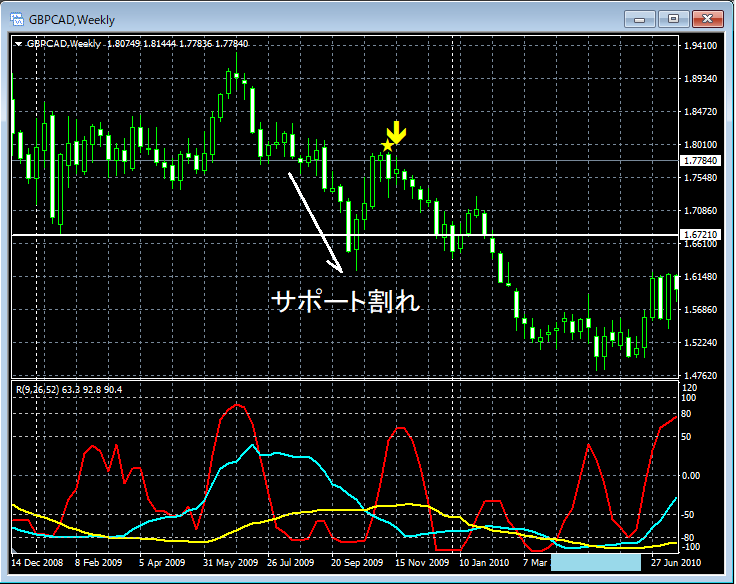
The higher-timeframe situation is omitted. On the previous daily chart,Support linewas broken below and then rosemBDSR (two RCI filter) return-sell signallights up, and the price is moving lower.
As a result,RCI26 (mid-term RCI)continues to fall toward the bottom area (around the light blue box).
In the above example,RCI 3-line crossoveris used to logically link higher and lower timeframes,to look for the downside target of RCI; for more detailed explanation of this method, please refer to the attached PDF below.
312th attached PDF file【mBDSRhint1312_20241003.pdf】
“【Important】Considering the downtrend target using RCI 3-line crossover (8)”
※ Please note that the charts shown in this article may include circles, straight lines, and boxes for ease of explanation.
Indicator "BODSOR・mBDSR" that shines in combination with RCI
and Method & Case Studies (PDF) ★GogoJungle AWARD2020 winner★
https://www.gogojungle.co.jp/tools/indicators/11836
The PDF file includes 325 files (over 1,200 pages, over 400,000 characters in total).
Many of them areexamples that, by using RCI 3-line crossover to logically link higher and lower timeframes, sequentially examine multiple lower-timeframe conditions and ultimately wait for an entry timing (the mBDSR signal) on the lower timeframe as a buy-the-ddip or a pullback sell.
In addition,there are many that emphasize identifying points where multiple entry bases converge..
Note also thatthere is also a method to explore upside and downside targets using RCI 3-line crossover..
In the PDF explanations,more than 1,200 chartsare used.

and Method & Case Studies (PDF) ★GogoJungle AWARD2020 winner★
https://www.gogojungle.co.jp/tools/indicators/11836
Pound / Canadian Dollar GBP/CAD Weekly
The higher-timeframe situation is omitted. On the previous daily chart,Support linewas broken below and then rosemBDSR (two RCI filter) return-sell signallights up, and the price is moving lower.
As a result,RCI26 (mid-term RCI)continues to fall toward the bottom area (around the light blue box).
In the above example,RCI 3-line crossoveris used to logically link higher and lower timeframes,to look for the downside target of RCI; for more detailed explanation of this method, please refer to the attached PDF below.
312th attached PDF file【mBDSRhint1312_20241003.pdf】
“【Important】Considering the downtrend target using RCI 3-line crossover (8)”
※ Please note that the charts shown in this article may include circles, straight lines, and boxes for ease of explanation.
Indicator "BODSOR・mBDSR" that shines in combination with RCI
and Method & Case Studies (PDF) ★GogoJungle AWARD2020 winner★
https://www.gogojungle.co.jp/tools/indicators/11836
The PDF file includes 325 files (over 1,200 pages, over 400,000 characters in total).
Many of them areexamples that, by using RCI 3-line crossover to logically link higher and lower timeframes, sequentially examine multiple lower-timeframe conditions and ultimately wait for an entry timing (the mBDSR signal) on the lower timeframe as a buy-the-ddip or a pullback sell.
In addition,there are many that emphasize identifying points where multiple entry bases converge..
Note also thatthere is also a method to explore upside and downside targets using RCI 3-line crossover..
In the PDF explanations,more than 1,200 chartsare used.
× ![]()


