

Consider profit-taking targets using the RCI3 main line (8)
0
Indicator that shines in combination with RCI: 【BODSOR・mBDSR】
Methods, case studies (PDF) ★GogoJungle AWARD2020 winner★
https://www.gogojungle.co.jp/tools/indicators/11836
Swiss Franc / Yen CHFJPY Daily
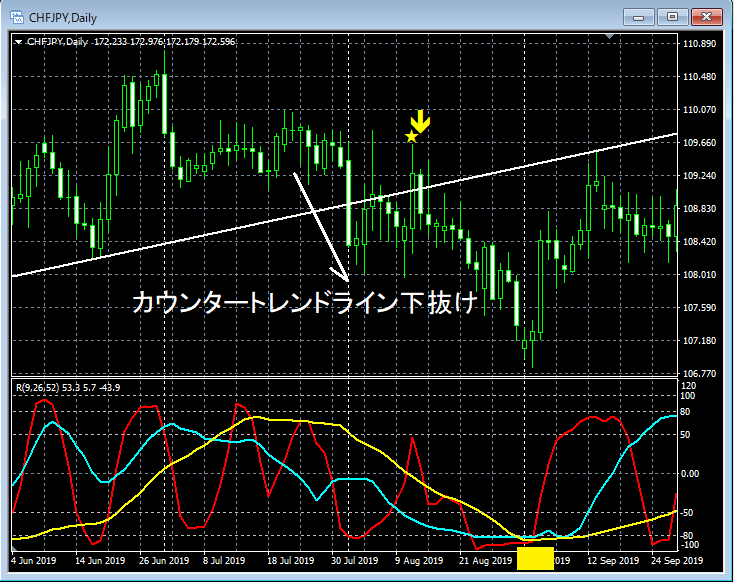
The higher-timeframe situation is omitted. On the daily chart above,the counter-trend lineis broken below,mBDSR (two RCI lines) selling signallights up, and the price continues to decline.
As a resultRCI52 (long-term RCI)continues to fall toward a bottom area (around the yellow box).
In the above example,RCI three-line systemlinks the higher- and lower-timeframes logically,to explore the downward target for RCIusing this method; detailed explanation is delegated to the attached PDF below.
311st attached PDF file 【mBDSRhint1311_20241003.pdf】
“【Important】Thinking of decline targets using the three-line RCI (7)”
Note: The charts mentioned in this article may include circles, lines, and rectangles for explanatory convenience.
Indicator that shines in combination with RCI: 【BODSOR・mBDSR】
Methods, case studies (PDF) ★GogoJungle AWARD2020 winner★
https://www.gogojungle.co.jp/tools/indicators/11836
The PDF file includes 323 items (over 1,000 pages, over 350,000 characters).
Many of them consist ofexamples that, by using the three-line RCI system to logically link higher and lower timeframes, sequentially examine the状況 of multiple lower timeframes, and ultimately wait for the timing to buy on dips or sell on rallies in the lower timeframes (the sign of mBDSR)..
Also,many focus on identifying points where multiple entry signals coincide..
In addition,there are methods for exploring upward targets and downward targets using the three-line RCI..
In the PDF explanations,over 1,000 chartsare used.

Methods, case studies (PDF) ★GogoJungle AWARD2020 winner★
https://www.gogojungle.co.jp/tools/indicators/11836
Swiss Franc / Yen CHFJPY Daily
The higher-timeframe situation is omitted. On the daily chart above,the counter-trend lineis broken below,mBDSR (two RCI lines) selling signallights up, and the price continues to decline.
As a resultRCI52 (long-term RCI)continues to fall toward a bottom area (around the yellow box).
In the above example,RCI three-line systemlinks the higher- and lower-timeframes logically,to explore the downward target for RCIusing this method; detailed explanation is delegated to the attached PDF below.
311st attached PDF file 【mBDSRhint1311_20241003.pdf】
“【Important】Thinking of decline targets using the three-line RCI (7)”
Note: The charts mentioned in this article may include circles, lines, and rectangles for explanatory convenience.
Indicator that shines in combination with RCI: 【BODSOR・mBDSR】
Methods, case studies (PDF) ★GogoJungle AWARD2020 winner★
https://www.gogojungle.co.jp/tools/indicators/11836
The PDF file includes 323 items (over 1,000 pages, over 350,000 characters).
Many of them consist ofexamples that, by using the three-line RCI system to logically link higher and lower timeframes, sequentially examine the状況 of multiple lower timeframes, and ultimately wait for the timing to buy on dips or sell on rallies in the lower timeframes (the sign of mBDSR)..
Also,many focus on identifying points where multiple entry signals coincide..
In addition,there are methods for exploring upward targets and downward targets using the three-line RCI..
In the PDF explanations,over 1,000 chartsare used.
× ![]()


