

Consider profit-taking targets using the RCI3 single line (7)
0
Indicator that excels in combination with RCI: 【BODSOR・mBDSR】
methodology and case studies (PDF) ★GogoJungle AWARD2020 winner★
https://www.gogojungle.co.jp/tools/indicators/11836
EURUSD 1-minute chart
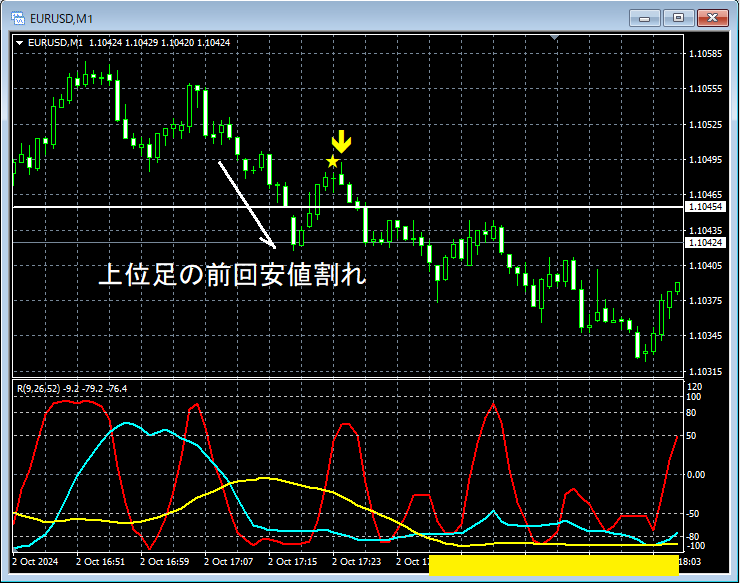
The higher time-frame context is omitted. On the above 1-minute chart,the previous swing low of the higher time framewas breached,mBDSR (two RCI lines filter) sell signallighting up, and price is steadily moving lower.
As a result,RCI52 (long-term RCI)continues to decline toward the bottom area (around the yellow square).
In the above example,RCI 3-line methodlinks the higher and lower time frames logically,to explore the downside targets of RCI; the detailed explanation of this method is left to the attached PDF below.
310th attached PDF file 【mBDSRhint1310_20241003.pdf】
「【Important】Thinking about downside targets using the 3-line RCI (6)」
※ Please note that in the charts introduced in this article, for convenience of explanation, circles, lines, and rectangles may be drawn.
Indicator that shines in combination with RCI: 【BODSOR・mBDSR】
methodology and case studies (PDF) ★GogoJungle AWARD2020 winner★
https://www.gogojungle.co.jp/tools/indicators/11836
The PDF file includes 320 items (over 1,000 pages, over 350,000 characters in total).
Many of these consist ofcases where the higher and lower time frames are logically linked using the 3-line RCI, to sequentially analyze multiple lower time-frame conditions, ultimately waiting for on-lower-time-frame buy-the-dips or sell-the-rallies signals (i.e., mBDSR signals).
Additionally,many focus on identifying points where multiple entry reasons overlap.
Furthermore,there are also methods that explore upside targets and downside targets using the three-line RCI.
The explanations in the PDF file useover 1,000 charts.

methodology and case studies (PDF) ★GogoJungle AWARD2020 winner★
https://www.gogojungle.co.jp/tools/indicators/11836
EURUSD 1-minute chart
The higher time-frame context is omitted. On the above 1-minute chart,the previous swing low of the higher time framewas breached,mBDSR (two RCI lines filter) sell signallighting up, and price is steadily moving lower.
As a result,RCI52 (long-term RCI)continues to decline toward the bottom area (around the yellow square).
In the above example,RCI 3-line methodlinks the higher and lower time frames logically,to explore the downside targets of RCI; the detailed explanation of this method is left to the attached PDF below.
310th attached PDF file 【mBDSRhint1310_20241003.pdf】
「【Important】Thinking about downside targets using the 3-line RCI (6)」
※ Please note that in the charts introduced in this article, for convenience of explanation, circles, lines, and rectangles may be drawn.
Indicator that shines in combination with RCI: 【BODSOR・mBDSR】
methodology and case studies (PDF) ★GogoJungle AWARD2020 winner★
https://www.gogojungle.co.jp/tools/indicators/11836
The PDF file includes 320 items (over 1,000 pages, over 350,000 characters in total).
Many of these consist ofcases where the higher and lower time frames are logically linked using the 3-line RCI, to sequentially analyze multiple lower time-frame conditions, ultimately waiting for on-lower-time-frame buy-the-dips or sell-the-rallies signals (i.e., mBDSR signals).
Additionally,many focus on identifying points where multiple entry reasons overlap.
Furthermore,there are also methods that explore upside targets and downside targets using the three-line RCI.
The explanations in the PDF file useover 1,000 charts.
× ![]()


