
[Today's USD/JPY] Reversal from the third point of the downward trendline and return-sell signal from mBDSR (RCI with 2 filters)
Indicator that shines in combination with RCI: BODSOR・mBDSR
Method and Case Study (PDF) ★GogoJungle AWARD2020 winner★
https://www.gogojungle.co.jp/tools/indicators/11836
Today (October 8, 2024) I will take the USD/JPY as an example and write a little about selling on rallies near the 15-minute descending trendline.
“RCI three-line + mBDSR”I believe this is very important for effective use.
USD/JPY 15-minute
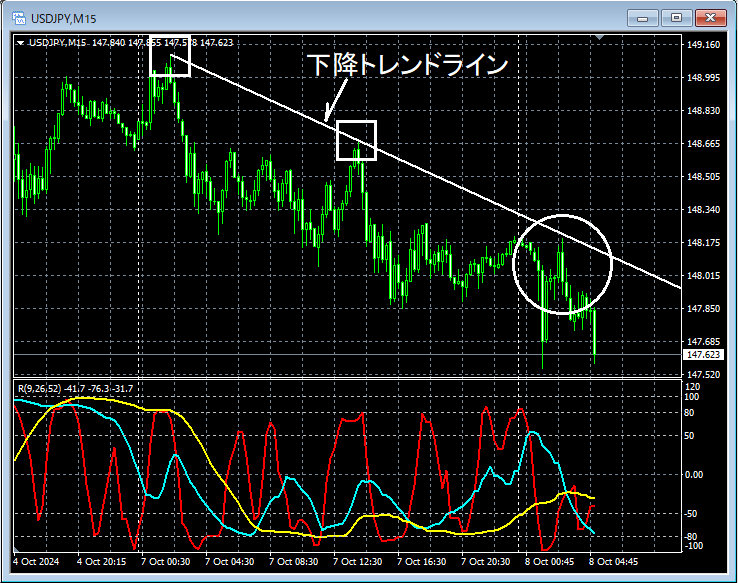
Main window:Descending trendline
Sub window: RCI three-line
If you look around the area circled in white on the 15-minute chart,Descending trendline (third point)has risen close to it. It might be a scene where a pullback would not be surprising. I will examine this area in detail on the 1-minute chart.
USD/JPY 1-minute
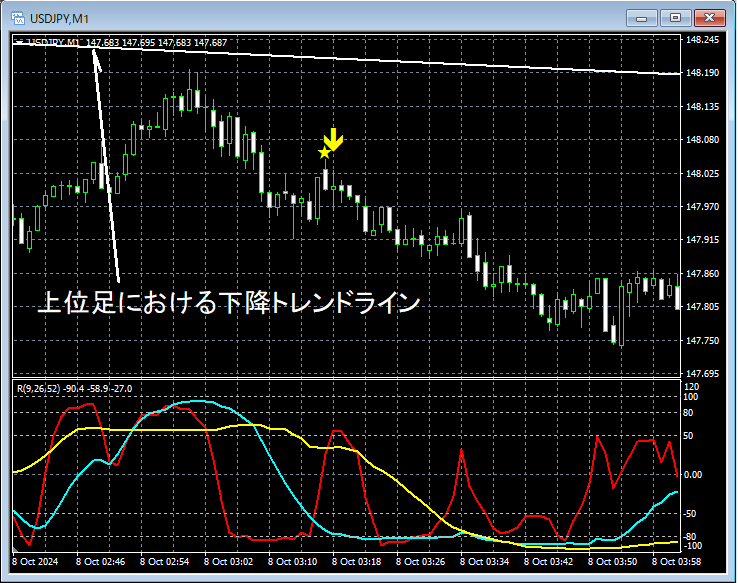
Main window:mBDSR signal (RCI two-line filter)
At the 15-minute levelDescending trendline
Sub window: RCI three-line
On the 1-minute chart, after rising close to the 15-minute levelDescending trendlineit turns down, and with the subsequent risemBDSR (RCI two-line filter) pullback signallights up, indicating further downside.
In the above example, the resistance at the higher-timeframeDescending trendlineserves as the pullback resistance, and the timing of the move down can be captured withmBDSR signalas a help.
From this example,a trading method focused on trendlinesandmBDSR signalsshow a high degree of harmony.
※Please note that for readability some charts in this article may have added circles, lines, or boxes.
Indicator that shines in combination with RCI: BODSOR・mBDSR
Method and Case Study (PDF) ★GogoJungle AWARD2020 winner★
https://www.gogojungle.co.jp/tools/indicators/11836
The PDF file includes 320 items (over 1,000 pages, over 350,000 characters).
Many of them are cases where several lower-timeframe conditions are linked logically through the three-line RCI to higher timeframes, and finally waiting for a buy-the-dull-pullback or sell-the-rally timing (the mBDSR signal) on the lower timeframes.
Additionally,there are many cases that emphasize identifying points where multiple entry reasons converge.Also included are cases exploring upward and downward targets using the three-line RCI.
In the description within the PDF,more than 1,000 charts
are used.

Method and Case Study (PDF) ★GogoJungle AWARD2020 winner★
https://www.gogojungle.co.jp/tools/indicators/11836
Today (October 8, 2024) I will take the USD/JPY as an example and write a little about selling on rallies near the 15-minute descending trendline.
“RCI three-line + mBDSR”I believe this is very important for effective use.
USD/JPY 15-minute
Main window:Descending trendline
Sub window: RCI three-line
If you look around the area circled in white on the 15-minute chart,Descending trendline (third point)has risen close to it. It might be a scene where a pullback would not be surprising. I will examine this area in detail on the 1-minute chart.
USD/JPY 1-minute
Main window:mBDSR signal (RCI two-line filter)
At the 15-minute levelDescending trendline
Sub window: RCI three-line
On the 1-minute chart, after rising close to the 15-minute levelDescending trendlineit turns down, and with the subsequent risemBDSR (RCI two-line filter) pullback signallights up, indicating further downside.
In the above example, the resistance at the higher-timeframeDescending trendlineserves as the pullback resistance, and the timing of the move down can be captured withmBDSR signalas a help.
From this example,a trading method focused on trendlinesandmBDSR signalsshow a high degree of harmony.
※Please note that for readability some charts in this article may have added circles, lines, or boxes.
Indicator that shines in combination with RCI: BODSOR・mBDSR
Method and Case Study (PDF) ★GogoJungle AWARD2020 winner★
https://www.gogojungle.co.jp/tools/indicators/11836
The PDF file includes 320 items (over 1,000 pages, over 350,000 characters).
Many of them are cases where several lower-timeframe conditions are linked logically through the three-line RCI to higher timeframes, and finally waiting for a buy-the-dull-pullback or sell-the-rally timing (the mBDSR signal) on the lower timeframes.
Additionally,there are many cases that emphasize identifying points where multiple entry reasons converge.Also included are cases exploring upward and downward targets using the three-line RCI.
In the description within the PDF,more than 1,000 charts
are used.