

Use the RCI3 single line to consider profit-taking targets (6)
0
Indicator that captures “top and bottom reversals” in combination with RCI【mBDSR】
and methods and case studies (PDF) ★GogoJungle AWARD2020 winner★
https://www.gogojungle.co.jp/tools/indicators/11836
The above product includes 318 PDFs. For a list of the titles of those PDFs, please refer to the article below.
About the 318 PDF files included with 【BODSOR・mBDSR】
https://www.gogojungle.co.jp/finance/navi/articles/34271
EURJPY 5-minute chart
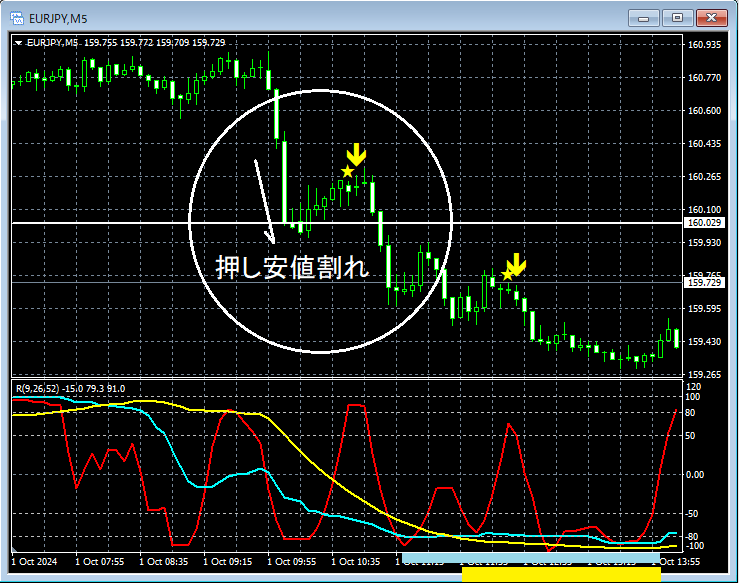
The context of higher timeframes is omitted. On the above 4-hour chart,mBDSR (two RCI lines filter) sell signallights up, and afterwardsthe price breaks supportand continues to drop firmly.
As a resultRCI26 (mid-term RCI) and RCI52 (long-term RCI)continue to fall toward the bottom range (around the light blue or yellow squares).
In the above example,RCI three-line combinationis used to logically link the higher and lower timeframes,to explore the downside targets of RCIhowever, the detailed explanation of this method is left to the attached PDFs below.
308th attached PDF file【mBDSRhint1308_20241002.pdf】
“【Important】Think about downside targets using RCI three lines (4)”
309th attached PDF file【mBDSRhint1309_20241003V1.pdf】
“【Important】Think about downside targets using RCI three lines (5)”
Indicator that shines when combined with RCI【BODSOR・mBDSR】
and methods and case studies (PDF) ★GogoJungle AWARD2020 winner★
https://www.gogojungle.co.jp/tools/indicators/11836
The PDF files include 318 items (over 1,000 pages, over 350,000 characters in total).
Many of them aresummaries of cases where multiple lower-timeframe conditions are evaluated sequentially by logically linking higher and lower timeframes with the RCI three-line method, ultimately waiting for the timing of a bullish signal on the lower timeframes (i.e., the mBDSR signal).in other words.
Additionally,there are many works focusing on identifying points where multiple entry reasons overlap..
The explanation usesover 1,000 charts.are used.

and methods and case studies (PDF) ★GogoJungle AWARD2020 winner★
https://www.gogojungle.co.jp/tools/indicators/11836
The above product includes 318 PDFs. For a list of the titles of those PDFs, please refer to the article below.
About the 318 PDF files included with 【BODSOR・mBDSR】
https://www.gogojungle.co.jp/finance/navi/articles/34271
EURJPY 5-minute chart
The context of higher timeframes is omitted. On the above 4-hour chart,mBDSR (two RCI lines filter) sell signallights up, and afterwardsthe price breaks supportand continues to drop firmly.
As a resultRCI26 (mid-term RCI) and RCI52 (long-term RCI)continue to fall toward the bottom range (around the light blue or yellow squares).
In the above example,RCI three-line combinationis used to logically link the higher and lower timeframes,to explore the downside targets of RCIhowever, the detailed explanation of this method is left to the attached PDFs below.
308th attached PDF file【mBDSRhint1308_20241002.pdf】
“【Important】Think about downside targets using RCI three lines (4)”
309th attached PDF file【mBDSRhint1309_20241003V1.pdf】
“【Important】Think about downside targets using RCI three lines (5)”
Indicator that shines when combined with RCI【BODSOR・mBDSR】
and methods and case studies (PDF) ★GogoJungle AWARD2020 winner★
https://www.gogojungle.co.jp/tools/indicators/11836
The PDF files include 318 items (over 1,000 pages, over 350,000 characters in total).
Many of them aresummaries of cases where multiple lower-timeframe conditions are evaluated sequentially by logically linking higher and lower timeframes with the RCI three-line method, ultimately waiting for the timing of a bullish signal on the lower timeframes (i.e., the mBDSR signal).in other words.
Additionally,there are many works focusing on identifying points where multiple entry reasons overlap..
The explanation usesover 1,000 charts.are used.
× ![]()


