

Consider target profit using three-line RCI (5)
Indicator that captures “tops/bottoms and reversals” in combination with RCI: 【mBDSR】
Methods & Case Studies (PDF) ★GogoJungle AWARD2020 Winner★
https://www.gogojungle.co.jp/tools/indicators/11836
The above products include 312 PDFs. For a list of their PDF titles, please refer to the article below.
About the 312 PDF files included with 【BODSOR・mBDSR】
https://www.gogojungle.co.jp/finance/navi/articles/34271
Crude Oil WTI 4-hour chart
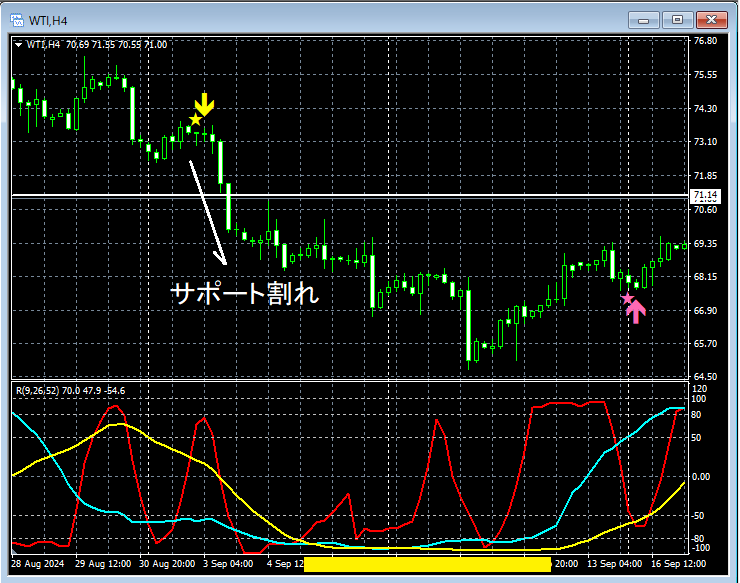
The status of the higher timeframes is omitted. On the above 4-hour chart,mBDSR (two RCI lines) sell-off signal lights up, and afterward,Support is broken and the price continues to drop.
As a resultRCI52 (long-term RCI) continues to fall toward the bottom area (around the yellow square).
In the above example,Using the 3-line RCI to logically link the higher and lower timeframes allows one to probe the downward path of the RCI, but the detailed explanation of this method is left to the accompanying PDFs below.
307th accompanying PDF file 【mBDSRhint1307_20241002.pdf】
「[Important] Thinking about declines using the 3-line RCI (3)」
Indicator that shines with the combination of RCI: 【BODSOR・mBDSR】
Methods & Case Studies (PDF) ★GogoJungle AWARD2020 Winner★
https://www.gogojungle.co.jp/tools/indicators/11836
The PDF files consist of 312 items (over 1,000 pages, over 350,000 characters in total).
Many of them aresummaries of cases where multiple lower timeframes are logically linked by using the 3-line RCI to consider the states of several lower timeframes in sequence, ultimately waiting for an entry timing on the lower timeframe (i.e., the mBDSR signal) such as a buying dip or a pullback..
Additionally,a focus on capturing points where multiple entry reasons overlap is common.
The explanations useover 1,000 charts in total.

Methods & Case Studies (PDF) ★GogoJungle AWARD2020 Winner★
https://www.gogojungle.co.jp/tools/indicators/11836
The above products include 312 PDFs. For a list of their PDF titles, please refer to the article below.
About the 312 PDF files included with 【BODSOR・mBDSR】
https://www.gogojungle.co.jp/finance/navi/articles/34271
Crude Oil WTI 4-hour chart
The status of the higher timeframes is omitted. On the above 4-hour chart,mBDSR (two RCI lines) sell-off signal lights up, and afterward,Support is broken and the price continues to drop.
As a resultRCI52 (long-term RCI) continues to fall toward the bottom area (around the yellow square).
In the above example,Using the 3-line RCI to logically link the higher and lower timeframes allows one to probe the downward path of the RCI, but the detailed explanation of this method is left to the accompanying PDFs below.
307th accompanying PDF file 【mBDSRhint1307_20241002.pdf】
「[Important] Thinking about declines using the 3-line RCI (3)」
Indicator that shines with the combination of RCI: 【BODSOR・mBDSR】
Methods & Case Studies (PDF) ★GogoJungle AWARD2020 Winner★
https://www.gogojungle.co.jp/tools/indicators/11836
The PDF files consist of 312 items (over 1,000 pages, over 350,000 characters in total).
Many of them aresummaries of cases where multiple lower timeframes are logically linked by using the 3-line RCI to consider the states of several lower timeframes in sequence, ultimately waiting for an entry timing on the lower timeframe (i.e., the mBDSR signal) such as a buying dip or a pullback..
Additionally,a focus on capturing points where multiple entry reasons overlap is common.
The explanations useover 1,000 charts in total.
× ![]()


