

Consider exit targets using the RCI3 single line (4)
An Indicator that Captures Tops/Bottoms and Reversals in Combination with RCI [mBDSR]
Methods, Case Studies (PDF) ★GogoJungle AWARD 2020 Winner★
https://www.gogojungle.co.jp/tools/indicators/11836
The above products include 310 PDF files. For a list of the titles of those PDFs, please see the article below.
About the 310 attached PDF files for 【BODSOR・mBDSR】
https://www.gogojungle.co.jp/finance/navi/articles/34271
USD/CAD 30-minute chart
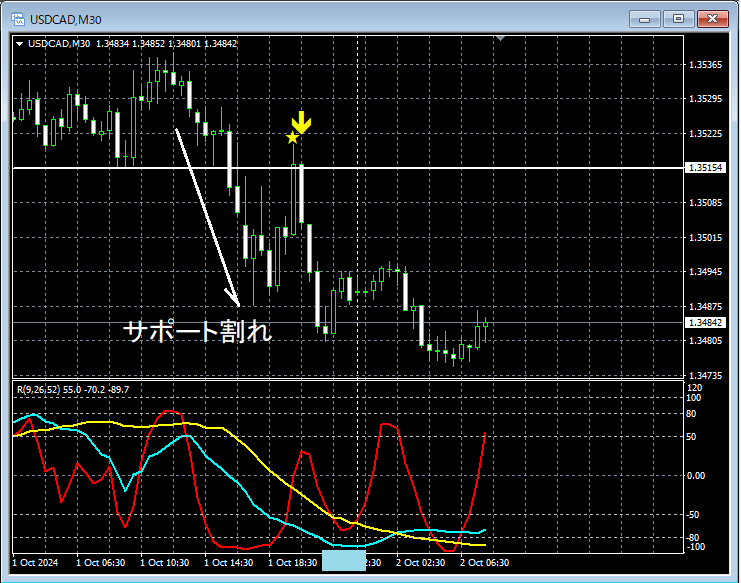
The status of the higher timeframe is omitted. On the upper 30-minute chart,Support Breakand the subsequent risemBDSR (Two RCI lines) Rebound Sell signallighting up, and subsequently, the price has declined steadily.
As a resultRCI26 (Mid-term RCI)has fallen to the lower price area (around the light blue square).
In the above example,Using three RCI linesto logically link the higher and lower timeframes,one can gauge the downward target for RCI, but a detailed explanation of that method is left to the attached PDFs below.
310th attached PDF file 【mBDSRhint1306_20241002.pdf】
“[Important] Thinking about Downside Targets Using 3 RCI Lines (2)”
An indicator that shines when combined with RCI: 【BODSOR・mBDSR】
Methods, Case Studies (PDF) ★GogoJungle AWARD 2020 Winner★
https://www.gogojungle.co.jp/tools/indicators/11836
The PDF files come with 310 items (over 1,000 pages in total, over 350,000 characters in total).
Many of them aresummaries of how to logically link the higher and lower timeframes using three RCI lines, sequentially examining multiple lower timeframes, and finally waiting for a timing to buy on dips or sell on rallies at the lower timeframes (i.e., the mBDSR signal).
Also,many of them emphasize identifying points where multiple entry reasons overlap.
In the explanations,more than 1,000 chartsare used.

Methods, Case Studies (PDF) ★GogoJungle AWARD 2020 Winner★
https://www.gogojungle.co.jp/tools/indicators/11836
The above products include 310 PDF files. For a list of the titles of those PDFs, please see the article below.
About the 310 attached PDF files for 【BODSOR・mBDSR】
https://www.gogojungle.co.jp/finance/navi/articles/34271
USD/CAD 30-minute chart
The status of the higher timeframe is omitted. On the upper 30-minute chart,Support Breakand the subsequent risemBDSR (Two RCI lines) Rebound Sell signallighting up, and subsequently, the price has declined steadily.
As a resultRCI26 (Mid-term RCI)has fallen to the lower price area (around the light blue square).
In the above example,Using three RCI linesto logically link the higher and lower timeframes,one can gauge the downward target for RCI, but a detailed explanation of that method is left to the attached PDFs below.
310th attached PDF file 【mBDSRhint1306_20241002.pdf】
“[Important] Thinking about Downside Targets Using 3 RCI Lines (2)”
An indicator that shines when combined with RCI: 【BODSOR・mBDSR】
Methods, Case Studies (PDF) ★GogoJungle AWARD 2020 Winner★
https://www.gogojungle.co.jp/tools/indicators/11836
The PDF files come with 310 items (over 1,000 pages in total, over 350,000 characters in total).
Many of them aresummaries of how to logically link the higher and lower timeframes using three RCI lines, sequentially examining multiple lower timeframes, and finally waiting for a timing to buy on dips or sell on rallies at the lower timeframes (i.e., the mBDSR signal).
Also,many of them emphasize identifying points where multiple entry reasons overlap.
In the explanations,more than 1,000 chartsare used.
× ![]()


