

Consider exit targets using this single line RCI3 (3)
0
Indicator to capture tops and bottoms by combining with RCI: mBDSR
Methods and Case Studies (PDF) ★GogoJungle AWARD2020 winner★
https://www.gogojungle.co.jp/tools/indicators/11836
The above products include 305 PDFs. For a list of the PDF titles and other details, please see the article below.
Regarding the 305 PDF files included with 【BODSOR・mBDSR】
https://www.gogojungle.co.jp/finance/navi/articles/34271
EUR/USD 1-hour chart
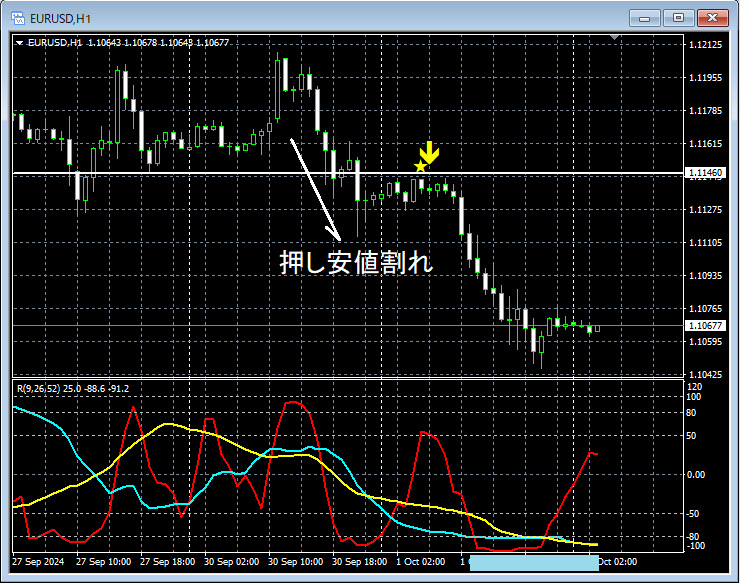
The status of the higher timeframes is omitted. On the above 1-hour chart,a break of the minor lowfollowed by a risemBDSR (two RCI lines filter) buy-back signallights up, and subsequently the price has fallen firmly.
As a resultRCI26 (medium-term RCI)has fallen to the bottom area (around the blue square).
In the above example,the three-RCI-line methodis used to logically link higher and lower timeframes,to explore the downward targets of RCI; the detailed explanation of this technique is left to the accompanying PDFs below.
305th accompanying PDF file【mBDSRhint1305_20241002.pdf】
“【Important】Think about downturn targets using the three-RCI-line method”
An indicator that shines when combined with RCI: 【BODSOR・mBDSR】
Methods and Case Studies (PDF) ★GogoJungle AWARD2020 winner★
https://www.gogojungle.co.jp/tools/indicators/11836
The PDF files amount to 305 in total (over 1,000 pages, over 350,000 characters).
Many of them aresummaries of using the three-RCI-line method to logically link higher and lower timeframes, sequentially examining the situations of multiple lower timeframes and ultimately waiting for entry timing on the lower timeframes (i.e., mBDSR signals) for buying on dips or selling on rises.
Additionally,many are focused on capturing points where multiple entry signals overlap.
In the explanations,over 1,000 chartsare used.

Methods and Case Studies (PDF) ★GogoJungle AWARD2020 winner★
https://www.gogojungle.co.jp/tools/indicators/11836
The above products include 305 PDFs. For a list of the PDF titles and other details, please see the article below.
Regarding the 305 PDF files included with 【BODSOR・mBDSR】
https://www.gogojungle.co.jp/finance/navi/articles/34271
EUR/USD 1-hour chart
The status of the higher timeframes is omitted. On the above 1-hour chart,a break of the minor lowfollowed by a risemBDSR (two RCI lines filter) buy-back signallights up, and subsequently the price has fallen firmly.
As a resultRCI26 (medium-term RCI)has fallen to the bottom area (around the blue square).
In the above example,the three-RCI-line methodis used to logically link higher and lower timeframes,to explore the downward targets of RCI; the detailed explanation of this technique is left to the accompanying PDFs below.
305th accompanying PDF file【mBDSRhint1305_20241002.pdf】
“【Important】Think about downturn targets using the three-RCI-line method”
An indicator that shines when combined with RCI: 【BODSOR・mBDSR】
Methods and Case Studies (PDF) ★GogoJungle AWARD2020 winner★
https://www.gogojungle.co.jp/tools/indicators/11836
The PDF files amount to 305 in total (over 1,000 pages, over 350,000 characters).
Many of them aresummaries of using the three-RCI-line method to logically link higher and lower timeframes, sequentially examining the situations of multiple lower timeframes and ultimately waiting for entry timing on the lower timeframes (i.e., mBDSR signals) for buying on dips or selling on rises.
Additionally,many are focused on capturing points where multiple entry signals overlap.
In the explanations,over 1,000 chartsare used.
× ![]()


