

Consider profit-taking targets using the three-line RCI (2)
Indicator that captures “tops and bottoms and reversals” in combination with RCI【mBDSR】
Methods and Case Studies (PDF) ★GogoJungle AWARD2020 Winner★
https://www.gogojungle.co.jp/tools/indicators/11836
The above products include 303 PDFs. For lists such as the titles of those PDFs, please see the article below.
About the 303 PDF files included with 【BODSOR・mBDSR】
https://www.gogojungle.co.jp/finance/navi/articles/34271
USDJPY 15-minute chart
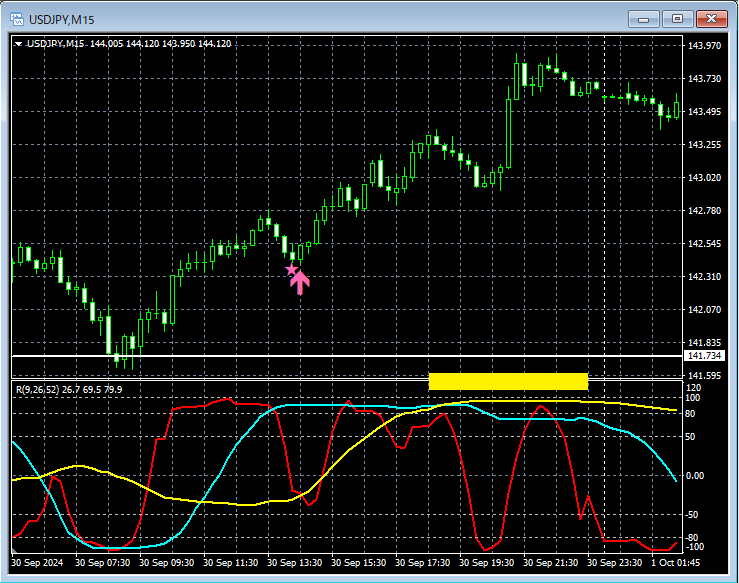
Top-level timeframe details are omitted. On the 5-minute chart above,Support linerebound occurred near themBDSR (two RCI lines filter) buy-the-dip signalfired, and subsequently price rose steadily.
As a resultRCI52 (long-term RCI)rose to the overbought zone (around the yellow box).
In the above example,Using three RCI linesto logically link higher and lower timeframes allows sequential consideration of multiple lower timeframes,to explore the upside target of RCI; however, detailed explanations of that method are left to the attached PDFs below.
303rd attached PDF file【mBDSRhint1303_20241001.pdf】
“Using three RCI lines to think about upside targets”
Indicator that shines when combined with RCI【BODSOR・mBDSR】
Methods and Case Studies (PDF) ★GogoJungle AWARD2020 Winner★
https://www.gogojungle.co.jp/tools/indicators/11836
The PDF files total 303 (over 1,000 pages, over 350,000 characters in total).
Many of them aresummaries of how to logically link higher and lower timeframes using three RCI lines to sequentially examine multiple lower-timeframe conditions, ultimately waiting for dip-buying or pullback selling timing on the lower timeframes (i.e., signals from mBDSR)in detail.
Additionally,many focus on identifying points where multiple entry reasons overlap.
The explanations usemore than 1,000 charts.

Methods and Case Studies (PDF) ★GogoJungle AWARD2020 Winner★
https://www.gogojungle.co.jp/tools/indicators/11836
The above products include 303 PDFs. For lists such as the titles of those PDFs, please see the article below.
About the 303 PDF files included with 【BODSOR・mBDSR】
https://www.gogojungle.co.jp/finance/navi/articles/34271
USDJPY 15-minute chart
Top-level timeframe details are omitted. On the 5-minute chart above,Support linerebound occurred near themBDSR (two RCI lines filter) buy-the-dip signalfired, and subsequently price rose steadily.
As a resultRCI52 (long-term RCI)rose to the overbought zone (around the yellow box).
In the above example,Using three RCI linesto logically link higher and lower timeframes allows sequential consideration of multiple lower timeframes,to explore the upside target of RCI; however, detailed explanations of that method are left to the attached PDFs below.
303rd attached PDF file【mBDSRhint1303_20241001.pdf】
“Using three RCI lines to think about upside targets”
Indicator that shines when combined with RCI【BODSOR・mBDSR】
Methods and Case Studies (PDF) ★GogoJungle AWARD2020 Winner★
https://www.gogojungle.co.jp/tools/indicators/11836
The PDF files total 303 (over 1,000 pages, over 350,000 characters in total).
Many of them aresummaries of how to logically link higher and lower timeframes using three RCI lines to sequentially examine multiple lower-timeframe conditions, ultimately waiting for dip-buying or pullback selling timing on the lower timeframes (i.e., signals from mBDSR)in detail.
Additionally,many focus on identifying points where multiple entry reasons overlap.
The explanations usemore than 1,000 charts.
× ![]()


