

Pullback buy signal for mBDSR (RCI two-filter) with cut lines and lower timeframe
Indicator 【mBDSR】 that captures tops and bottoms and reversals in combination with RCI
Method and Case Studies (PDF) ★GogoJungle AWARD2020 winner★
https://www.gogojungle.co.jp/tools/indicators/11836
The above product includes 302 PDFs. For a list of their PDF titles and related information, please see the article below.
About the 302 PDF files included with 【BODSOR・mBDSR】
https://www.gogojungle.co.jp/finance/navi/articles/34271
USD/JPY 4-hour chart
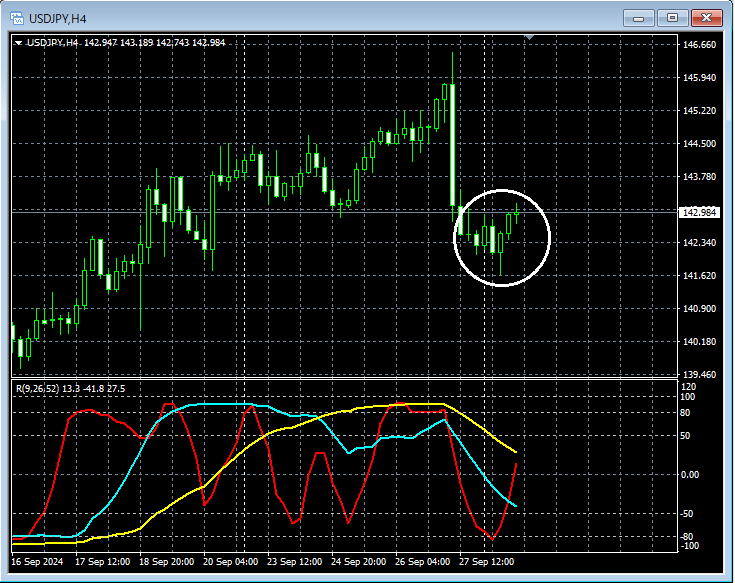
Looking at the area circled in white on the 4-hour chart, it is a candlestick pattern suggesting an upward moveBreakaway gapappears. It may not be strange to consider a pullback buying on lower timeframes.
USD/JPY 15-minute chart
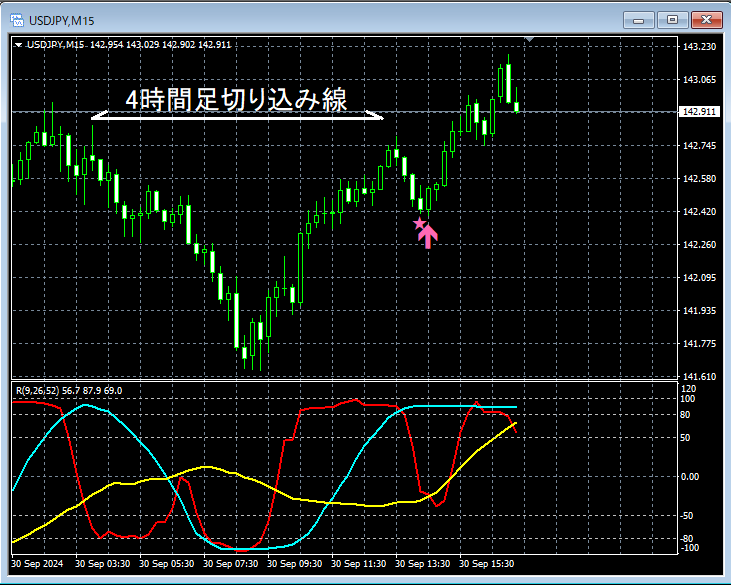
On the 15-minute chart above, in thebreakaway gapthat appeared on the 4-hour chart,mBDSR (RCI two-line filter) pullback buy signallights up and the price rises firmly.
From this example,a trading method focused on the breakaway lineandthe signals of mBDSRshow high compatibility.
Indicator 【BODSOR・mBDSR】 that delivers strong performance in combination with RCI
Method and Case Studies (PDF) ★GogoJungle AWARD2020 winner★
https://www.gogojungle.co.jp/tools/indicators/11836
The PDF files include 302 PDFs (over 1,000 pages in total, over 350,000 characters).
Many of them are abouta logical linking of upper and lower timeframes using three RCI lines, examining multiple lower timeframes step by step, and ultimately waiting for pullback buying or retracement selling timing on the lower timeframe (i.e., the signals of mBDSR)as described.
Additionally,there are many that emphasize identifying points where multiple entry reasons overlap.
A total ofmore than 1,000 chartswere used in the explanations.

Method and Case Studies (PDF) ★GogoJungle AWARD2020 winner★
https://www.gogojungle.co.jp/tools/indicators/11836
The above product includes 302 PDFs. For a list of their PDF titles and related information, please see the article below.
About the 302 PDF files included with 【BODSOR・mBDSR】
https://www.gogojungle.co.jp/finance/navi/articles/34271
USD/JPY 4-hour chart
Looking at the area circled in white on the 4-hour chart, it is a candlestick pattern suggesting an upward moveBreakaway gapappears. It may not be strange to consider a pullback buying on lower timeframes.
USD/JPY 15-minute chart
On the 15-minute chart above, in thebreakaway gapthat appeared on the 4-hour chart,mBDSR (RCI two-line filter) pullback buy signallights up and the price rises firmly.
From this example,a trading method focused on the breakaway lineandthe signals of mBDSRshow high compatibility.
Indicator 【BODSOR・mBDSR】 that delivers strong performance in combination with RCI
Method and Case Studies (PDF) ★GogoJungle AWARD2020 winner★
https://www.gogojungle.co.jp/tools/indicators/11836
The PDF files include 302 PDFs (over 1,000 pages in total, over 350,000 characters).
Many of them are abouta logical linking of upper and lower timeframes using three RCI lines, examining multiple lower timeframes step by step, and ultimately waiting for pullback buying or retracement selling timing on the lower timeframe (i.e., the signals of mBDSR)as described.
Additionally,there are many that emphasize identifying points where multiple entry reasons overlap.
A total ofmore than 1,000 chartswere used in the explanations.
× ![]()


