

Consider profit-taking targets using three-line RSI (1)
Indicator "Capture Tops/Bottoms and Reversals" combined with RCI: mBDSR
Methods and Case Studies (PDF) ★GogoJungle AWARD2020 Recipient★
https://www.gogojungle.co.jp/tools/indicators/11836
The above products include 302 PDFs. For lists of their PDF titles and related information, please see the article below.
About the 302 PDF files included with 【BODSOR・mBDSR】
https://www.gogojungle.co.jp/finance/navi/articles/34271
GBPJPY 5-minute
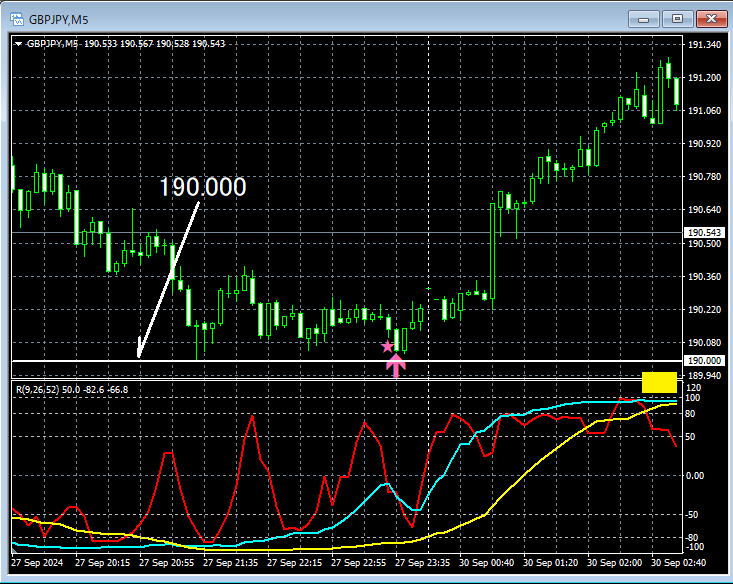
The higher timeframe context is omitted. On the 5-minute chart above, it may reach psychological thresholdsRound-number (in this case, 190.000)When it falls close to this levelmBDSR (RCI double-filter) buying signallights up, and subsequently the price rises firmly.
As a resultRCI52 (long-term RCI)rises toward the topping zone (around the yellow square).
In the above example,Three-RCI lineis used to logically link higher and lower timeframes, allowing sequential analysis of multiple lower timeframes, andto explore the potential upside target for RCI; however, detailed explanation of this method is left to the attached PDFs below.
302nd attached PDF file 【mBDSRhint1302_20240930.pdf】
“Using three RCI lines to consider profit targets”
Indicator with powerful performance when combined with RCI【BODSOR・mBDSR】
Methods and Case Studies (PDF) ★GogoJungle AWARD2020 Recipient★
https://www.gogojungle.co.jp/tools/indicators/11836
The PDF files include 302 items (over 1,000 pages, over 350,000 characters in total).
Many of them aresummaries of examples where RCI three-line links logically connect higher and lower timeframes, and eventually drill down to waiting for pullbacks or pullback entries on the lower timeframes (i.e., mBDSR signals)..
Also,many focus on identifying points where multiple entry reasons overlap.
In the explanations,over 1,000 chartsare used.

Methods and Case Studies (PDF) ★GogoJungle AWARD2020 Recipient★
https://www.gogojungle.co.jp/tools/indicators/11836
The above products include 302 PDFs. For lists of their PDF titles and related information, please see the article below.
About the 302 PDF files included with 【BODSOR・mBDSR】
https://www.gogojungle.co.jp/finance/navi/articles/34271
GBPJPY 5-minute
The higher timeframe context is omitted. On the 5-minute chart above, it may reach psychological thresholdsRound-number (in this case, 190.000)When it falls close to this levelmBDSR (RCI double-filter) buying signallights up, and subsequently the price rises firmly.
As a resultRCI52 (long-term RCI)rises toward the topping zone (around the yellow square).
In the above example,Three-RCI lineis used to logically link higher and lower timeframes, allowing sequential analysis of multiple lower timeframes, andto explore the potential upside target for RCI; however, detailed explanation of this method is left to the attached PDFs below.
302nd attached PDF file 【mBDSRhint1302_20240930.pdf】
“Using three RCI lines to consider profit targets”
Indicator with powerful performance when combined with RCI【BODSOR・mBDSR】
Methods and Case Studies (PDF) ★GogoJungle AWARD2020 Recipient★
https://www.gogojungle.co.jp/tools/indicators/11836
The PDF files include 302 items (over 1,000 pages, over 350,000 characters in total).
Many of them aresummaries of examples where RCI three-line links logically connect higher and lower timeframes, and eventually drill down to waiting for pullbacks or pullback entries on the lower timeframes (i.e., mBDSR signals)..
Also,many focus on identifying points where multiple entry reasons overlap.
In the explanations,over 1,000 chartsare used.
× ![]()


