

【Multiple Entry Basis】Break of support price and 2B reversal and mBDSR (RCI2 two-line filter) return selling signal
============
【Special Video vol.01/Blacksun】
https://www.gogojungle.co.jp/info/22955
【Special Video vol.02/Blacksun】
https://www.gogojungle.co.jp/info/22956
【Special Video vol.03/Blacksun】
https://www.gogojungle.co.jp/info/22957
============
【MT5 Version Beta】 has been released!!
mBDSR (Product ID 11836) Purchase Bonus】 MT5 Indicator (Beta) “mBDSR (No filter, RC I filter, MA filter)”
https://www.gogojungle.co.jp/tools/indicators/56765
【Master RCI!! Trend Reversal, Buy the Dip, Sell on Dips】
An indicator that shines in combination with RCI【BODSOR・mBDSR】
and methodologies, case studies (PDF) ★GogoJungle AWARD 2020 winner★
https://www.gogojungle.co.jp/tools/indicators/11836
New Zealand Yen NZDJPY 1-hour chart
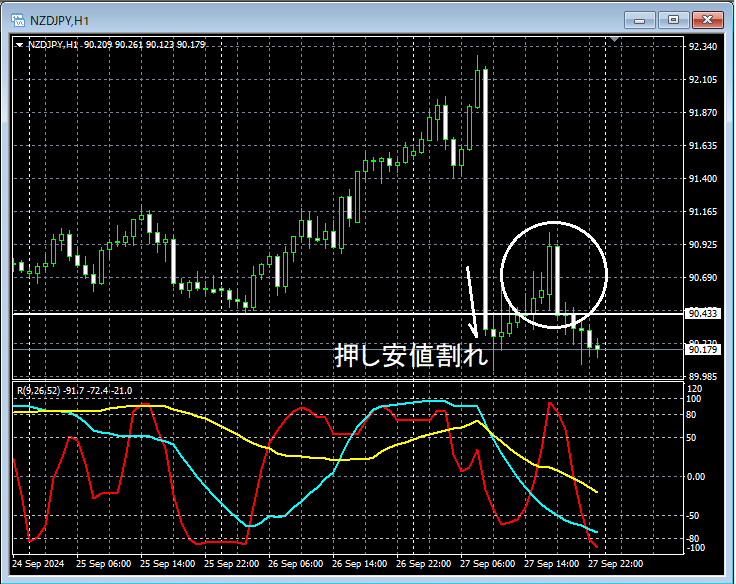
If you look at the area circled in white on the 1-hour chart above,you may see a break of a support levelfollowed by an upward movement indicating a decline2B Reversal (Two-Bar Reversal)appears (around the circled area). Therefore, it might not be strange to consider selling on rallies on lower timeframes. We will carefully monitor for signs of downward movement on lower timeframes.
New Zealand Yen NZDJPY 5-minute chart
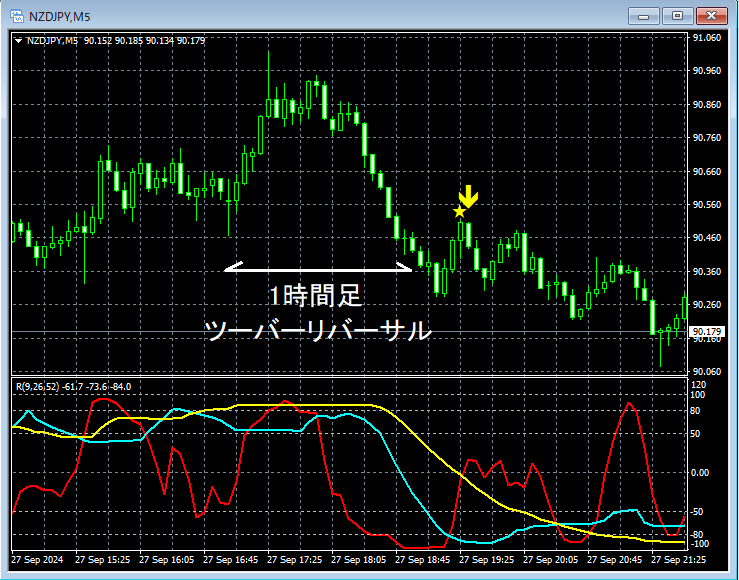
On the 5-minute chart above, the 1-hour chart shows2B Reversal (Two-Bar Reversal)occurring followed by a rise after a dropmBDSR (2-filter for RCI) Sell-on-Rally signallighting up and the price continues to drop.
From this example,the high coherence between trading techniques focusing on Dow Theory, the Two-Barrier Reversal, and double tops,andthe signals of mBDSRis evident.
※Please note that in the charts shown in this article, for ease of explanation, circles, lines, and rectangles may be added.
An indicator that shines in combination with RCI【BODSOR・mBDSR】
and methodologies, case studies (PDF) ★GogoJungle AWARD2020 winner★
https://www.gogojungle.co.jp/tools/indicators/11836
The PDF file has 358 files (over 1,400 pages, over 470,000 characters in total).
Most of these are aboutexploring the situations of multiple lower timeframes by logically linking higher and lower timeframes using three RC I lines, and ultimately waiting for a timing to buy on dips or sell on rallies on the lower timeframes (i.e., signs from mBDSR)..
In addition,many of them emphasize identifying points where multiple entry reasons overlap..
Also,they include methods to explore upside and downside targets using three RC I lines..
In the explanations within the PDF files,over 1,350 chartsare used.

【Special Video vol.01/Blacksun】
https://www.gogojungle.co.jp/info/22955
【Special Video vol.02/Blacksun】
https://www.gogojungle.co.jp/info/22956
【Special Video vol.03/Blacksun】
https://www.gogojungle.co.jp/info/22957
============
【MT5 Version Beta】 has been released!!
mBDSR (Product ID 11836) Purchase Bonus】 MT5 Indicator (Beta) “mBDSR (No filter, RC I filter, MA filter)”
https://www.gogojungle.co.jp/tools/indicators/56765
【Master RCI!! Trend Reversal, Buy the Dip, Sell on Dips】
An indicator that shines in combination with RCI【BODSOR・mBDSR】
and methodologies, case studies (PDF) ★GogoJungle AWARD 2020 winner★
https://www.gogojungle.co.jp/tools/indicators/11836
New Zealand Yen NZDJPY 1-hour chart
If you look at the area circled in white on the 1-hour chart above,you may see a break of a support levelfollowed by an upward movement indicating a decline2B Reversal (Two-Bar Reversal)appears (around the circled area). Therefore, it might not be strange to consider selling on rallies on lower timeframes. We will carefully monitor for signs of downward movement on lower timeframes.
New Zealand Yen NZDJPY 5-minute chart
On the 5-minute chart above, the 1-hour chart shows2B Reversal (Two-Bar Reversal)occurring followed by a rise after a dropmBDSR (2-filter for RCI) Sell-on-Rally signallighting up and the price continues to drop.
From this example,the high coherence between trading techniques focusing on Dow Theory, the Two-Barrier Reversal, and double tops,andthe signals of mBDSRis evident.
※Please note that in the charts shown in this article, for ease of explanation, circles, lines, and rectangles may be added.
An indicator that shines in combination with RCI【BODSOR・mBDSR】
and methodologies, case studies (PDF) ★GogoJungle AWARD2020 winner★
https://www.gogojungle.co.jp/tools/indicators/11836
The PDF file has 358 files (over 1,400 pages, over 470,000 characters in total).
Most of these are aboutexploring the situations of multiple lower timeframes by logically linking higher and lower timeframes using three RC I lines, and ultimately waiting for a timing to buy on dips or sell on rallies on the lower timeframes (i.e., signs from mBDSR)..
In addition,many of them emphasize identifying points where multiple entry reasons overlap..
Also,they include methods to explore upside and downside targets using three RC I lines..
In the explanations within the PDF files,over 1,350 chartsare used.
× ![]()


